DNA-mediated assembly of iron platinum (FePt) nanoparticles†
Sudhanshu
Srivastava
,
Bappaditya
Samanta
,
Palaniappan
Arumugam
,
Gang
Han
and
Vincent M.
Rotello
*
Department of Chemistry, University of Massachusetts, USA. E-mail: rotello@chem.umass.edu; Fax: +1-413-545-4490; Tel: +1-413-545-2058
First published on 30th October 2006
Abstract
Nanocomposite materials consisting of FePt nanoparticles and DNA were constructed via DNA-mediated “bricks and mortar” self-assembly. Electrostatic interaction between the cationic nanoparticles and the DNA through surface recognition led to the formation of extended composite aggregates. These DNA-assembled aggregates feature increased interparticle spacing arising from the DNA “mortar”. The enhanced structure and increased spacing in the bio-nanocomposite assembly was found to alter the magnetic properties of the assemblies, as demonstrated by a 54 K change in blocking temperature (TB).
Introduction
Nanoscale magnetic materials have attracted intense interest because of their potential applications in many areas including high-density magnetic recording, magnetic sensors, and cancer therapy.1–3 Recent developments in synthetic methodologies including the ability to prepare nanoparticles with unique shapes, high degrees of crystallinity and narrow size distribution4 have made nanoparticles useful materials for a range of applications.5The use of polymers6 and biomolecules7 as templates for the self-assembly of particles provides access to new materials featuring novel properties. The use of deoxyribonucleic acid (DNA) for generating assembled structures has been shown recently.8 DNA has been demonstrated to be a particularly versatile construction material due to its flexible length scale, rigidity and chemically programmable duplex structure.9 For example, Fitzmaurice and co-workers10 have shown that DNA was used as a template to assemble an array of gold nanoparticles between gold electrodes on a silicon oxide substrate. Alivisatos et al. also created discrete nanostructures of semiconductor nanoparticles/Au with DNA.11
In contrast to electronic materials, there have been relatively few examples of the use of DNA to assemble magnetic materials, e.g. Willner et al.12 controlled the magneto-mechanical properties of a cantilever by assembling magnetic particles on the cantilever surface with DNA. These studies, however, do not directly address the issue of interparticle spacing, a key factor in tuning the collective properties of nanometer-sized magnets.
In previous studies, dendrimer mediated self-assembly of Fe2O3 nanoparticles was used to demonstrate the controlled modulation of magnetic properties of nanoparticles, including blocking temperature (TB).13 Similarly, polymers functionalized with recognition elements assembled with magnetic nanoparticles also showed variation in the magnetic behavior.14 These magnetic nanoparticles provided a means to investigate the change in bulk magnetic properties as a function of both order and spacing. We report here the use of DNA to assemble magnetic nanoparticles, providing a route to magnetic bio-nanocomposites.
Results and discussion
In this study, FePt (∼7 nm)15 nanoparticles were fabricated and assembled with DNA16 to create bio-magnetic assemblies (Scheme 1). Trimethylammonium functionalized FePt monolayer protected nanoparticles (MPN 1)15 (Fig. 1) were self-assembled with 37-mer duplex DNA17via electrostatic interactions. MPN 1 nanoparticles were synthesized using lauric acid and dodecylamine capping ligands. Then the nanoparticles were made water dispersible by place exchange reaction with 10-carboxydecyltrimethylammonium bromide and 11-mercaptoundecyltrimethylammonium chloride ligands.18 To assemble the nanoparticles with DNA, a solution of MPN 1 was added dropwise to an excess of the DNA solution (1 : 10 molar ratio MPN 1 : DNA). The mixture rapidly became turbid, followed by slow precipitation resulting in dark brown films. In order to study the effect of self-assembly on the stability and structure of the DNA, circular dichroism (CD ) was performed on MPN 1 + DNA nanocomposites which indicated partial denaturation of the duplex DNA (see ESI† ).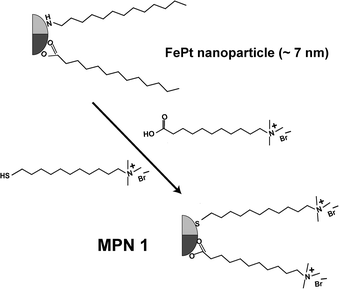 | ||
| Fig. 1 Structure of FePt (MPN 1) before and after place exchange. | ||
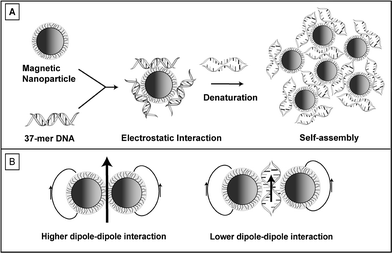 | ||
| Scheme 1 A) Magnetic nanoparticles assembled with DNA via electrostatic interaction. B) Schematic representation of magnetic dipole–dipole interaction between the nanoparticles before and after DNA assembly, showing partial denaturation of DNA during assembly. | ||
The interparticle spacing for MPN 1 and MPN 1 assembled with DNA was quantified by small angle X-ray scattering (SAXS) (Fig. 2). The MPN 1 and MPN 1 + DNA solutions were allowed to precipitate on thin Mylar sheets and the resulting films were analyzed. The q values, representative of average interparticle spacing, shift steadily downwards in the presence of DNA. The MPN 1 film alone shows a q value19 that corresponds to a center-to-center spacing of 7.8 nm while the DNA assembled nanocomposite exhibits a center-to-center spacing of 8.9 nm, an increase in interparticle spacing of 1.1 nm (Fig. 2).
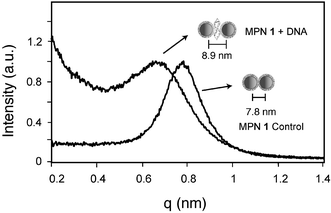 | ||
| Fig. 2 SAXS profiles for MPN 1 alone and DNA assembled MPN 1 (normalized). | ||
To study the morphological differences between unassembled particles and those assembled with DNA, transmission electron microscopy (TEM) was performed. The TEM samples were prepared identically to the SAXS samples through slow precipitation of a film of MPN 1 + DNA on carbon-coated copper TEM grids. MNP 1 showed some self-association (Fig. 3A) due to van der Waals contact. In contrast, MNP 1 + DNA composites showed network-like aggregates7b throughout the grid indicative of rapid precipitation (Fig. 3B).
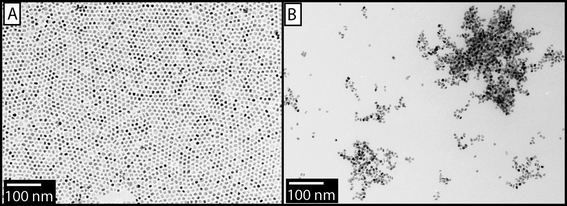 | ||
| Fig. 3 A) TEM image of MPN 1 (∼7 nm). B) Network-like aggregates of DNA assembled with MPN 1. | ||
A superconducting quantum interference device (SQUID) was used to acquire field-dependent magnetization analysis using zero-field-cooled (ZFC) and field-cooled (FC) measurements for the particles alone and after DNA assembly. MPN 1 (∼7 nm) nanoparticles are superparamagnetic at ambient temperature,20 becoming ferromagnetic at low temperatures. The temperature at which the superparamagnetic–ferromagnetic transition occurs is known as the blocking temperature (TB),21 which depends on the amount of magnetic material and interparticle spacings of the dipoles. The TB of a sample can be obtained through a ZFC/FC scan that sweeps at a chosen temperature range (300 K to 1.8 K) while recording the magnetic response of the sample to a constant applied field (100 Oe). In ZFC the magnetic dipoles of the particle will initially align in the direction of the magnetic field, with increasing temperature and due to its ferromagnetic behavior. Above the TB the dipoles will cancel each other due to thermal activation resulting in the magnetic moment approaching zero. The maximum point of this transition in the curve thus denotes the TB. In FC experiment the dipoles will again align in the direction of the field with decreasing temperature. In the final scan the dipoles will get locked in the magnetic field direction to maximize the magnetic moment.
The control sample (MPN 1) of precipitated particles showed a TB of 95 K while the DNA spaced sample showed a TB of 41 K (Fig. 4). This change in blocking temperature can be explained by a decrease in dipolar coupling arising from the increased interparticle spacing, as the TB of magnetic nanoparticles is directly related to their volume.22 Our samples were obtained from the exact same batch of nanoparticles, thus eliminating core size discrepancies. The observed decrease in TB is therefore a direct consequence of the DNA-mediated assembly: as the DNA assembles the particles, the dipolar coupling between particles decreases, resulting in an “effective” volume decrease compared to the control sample.
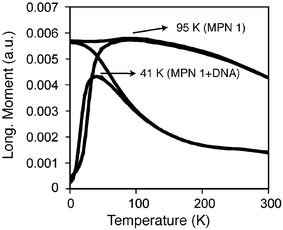 | ||
| Fig. 4 FC and ZFC magnetization plots for MPN 1 alone and assembled with DNA. | ||
Conclusions
In summary, we have demonstrated the use of DNA-mediated assembly of FePt nanoparticles to alter the magnetic properties of bio-nanocomposites. This assembly showed an increase in particle spacing as demonstrated by a shift to lower q values in the SAXS spectrum of the nanocomposite. TEM images also indicate the change in the morphology for the FePt particles and DNA-assembled nanocomposites. This structural modulation results in a decrease in TB for the particles. The observed modulation in the bulk magnetic properties is based solely on DNA-mediated self-assembly, providing a means to alter the magnetic properties of nanoparticle-based biomaterials. We are currently exploring new techniques to combine magnetic cores with biomolecules like proteins for further applications and will report our findings in due course.Experimental
Materials
All starting materials were purchased from Sigma-Aldrich Chemical Company except iron pentacarbonyl and dodecylamine. The latter chemicals were purchased from Acros Chemical Company and used without further purification. MilliQ water and ethanol solvents were also used without further purification. A Digi-Sense Temperature controller R/S (Model: 68900-11) was used to control the temperature.Synthesis
For place exchange 20 mg of FePt nanocrystals were taken in 5 mL dichloromethane. 10-Carboxydecyltrimethylammonium bromide (60 mg) and 11-mercaptoundecyltrimethylammonium chloride (60 mg) in 0.5 mL of ethanol were added to the nanocrystal dispersion and stirred for three days. The black precipitate obtained was isolated using centrifugation. It was rinsed three times using a mixture of ethanol and dichloromethane (1 : 10) and was dissolved in milliQ water.
Small angle X-ray scattering (SAXS)
Samples for SAXS analysis were prepared by placing a ∼1 cm2 piece of Mylar film at the bottom of a 2 mL vial that contains DNA solution. MPN 1 (5 µM in water) was added drop by drop to the DNA solution (50 µM in water) in a 1 : 10 molar ratio. The sample was allowed to fully precipitate. The remaining solution was then removed and the samples were dried completely under air.Transmission electron microscopy (TEM)
A drop of the turbid solution was placed on a 300 mesh carbon coated Cu grid. The samples were then examined on a JEOL 200 TEM operating at 200 keV.Superconducting quantum interference device (SQUID)
Thin films were prepared in the same way as the SAXS samples and were analyzed under SQUID. Data were acquired on a Quantum Design SQUID Magnetometer. ZFC–FC plots were acquired by cooling the sample to 1.8 K in the absence of a magnetic field, and then a field of 100 Oe was applied. Then the sample was slowly warmed to 300 K and returned to 1.8 K, thus acquiring FC and ZFC plots in a single temperature sweep.Acknowledgements
This research was supported by the National Science Foundation (CHE-0518487, MRSEC facilities and the Center for Hierarchical Manufacturing, DMI-0531171). We thank Qijun Xiao for his assistance in SQUID data analysis.References
- Y. W. Jun, Y. Y. Jung and J. Cheon, J. Am. Chem. Soc., 2002, 124, 615 CrossRef CAS.
- B. Kim, S. L. Tripp and A. Wei, J. Am. Chem. Soc., 2001, 123, 7955 CrossRef CAS.
- F. Sonvico, S. Mornet, S. Vasseur, C. Dubernet, D. Jaillard, J. Degrouard, J. Hoebeke, E. Duguet, P. Colombo and P. Couvreur, Bioconjugate Chem., 2005, 16, 1181 CrossRef CAS.
- S. Sun and H. Zeng, J. Am. Chem. Soc., 2002, 124, 8204 CrossRef CAS.
- J. Park, K. An, Y. Hwang, J. G. Park, H. J. Noh, J. Y. Kim, J. H. Park, N. M. Hwang and T. Hyeon, Nat. Mater., 2004, 3, 891 CrossRef CAS.
- A. K. Boal, F. Ilhan, J. E. DeRouchey, T. Thurn-Albrecht, T. P. Russell and V. M. Rotello, Nature, 2000, 404, 746 CrossRef CAS.
- (a) C. M. Niemeyer, Angew. Chem., Int. Ed., 2001, 40, 4128 CrossRef CAS; (b) S. Srivastava, A. Verma, B. L. Frankamp and V. M. Rotello, Adv. Mater., 2005, 17, 617 CrossRef CAS.
- (a) C. A. Mirkin, R. L. Letsinger, R. C. Mucic and J. J. Storhoff, Nature, 1996, 382, 607 CrossRef CAS; (b) X. Xu, N. L. Rosi, Y. Wang, F. Huo and C. A. Mirkin, J. Am. Chem. Soc., 2006, 128, 9286 CrossRef CAS; (c) H. A. Becerril, R. M. Stoltenberg, D. R. Wheeler, R. C. Davis, J. N. Harb and A. T. Woolley, J. Am. Chem. Soc., 2005, 127, 2828 CrossRef CAS.
- J. J. Storhoff and C. A. Mirkin, Chem. Rev., 1999, 99, 1849 CrossRef CAS.
- A. Ongaro, F. Griffin, P. Beecher, L. Nagle, D. Iacopino, A. Quinn, G. Redmond and D. Fitzmaurice, Chem. Mater., 2005, 17, 1959 CrossRef CAS.
- A. Fu, C. M. Micheel, J. Cha, H. Chang, H. Yang and A. P. Alivisatos, J. Am. Chem. Soc., 2004, 126, 10832 CrossRef CAS.
- Y. Weizmann, R. Elnathan, O. Lioubashevski and I. Willner, Nano Lett., 2005, 5, 741 CrossRef CAS.
- B. L. Frankamp, A. K. Boal, M. T. Tuominen and V. M. Rotello, J. Am. Chem. Soc., 2005, 127, 9731 CrossRef CAS.
- A. K. Boal, B. L. Frankamp, O. Uzun, M. T. Tuominen and V. M. Rotello, Chem. Mater., 2004, 16, 3252 CrossRef CAS.
- M. Chen, J. P. Liu and S. Sun, J. Am. Chem. Soc., 2004, 126, 8394 CrossRef CAS.
- Circular dichroism (CD) experiment on the MPN 1 + DNA showed denaturation of the DNA structure from its native form.
- G. Han, C. C. You, B. J. Kim, R. S. Turingan, N. S. Forbes, C. T. Martin and V. M. Rotello, Angew. Chem., Int. Ed., 2006, 45, 3165 CrossRef CAS.
- R. Hong, N. O. Fischer, T. Emrick and V. M. Rotello, Chem. Mater., 2005, 17, 4617 CrossRef CAS.
- S. Srivastava, B. L. Frankamp and V. M. Rotello, Chem. Mater., 2005, 17, 487 CrossRef CAS.
- In the superparamagnetic state the thermal energy kBT is large enough to overcome the energy barrier for magnetization reversal and produce rapid fluctuations that lead to a time-averaged magnetization of zero-termed superparamagnetic relaxation.
- In the case of non-interacting particles the energy barrier k1V is determined by the intrinsic anisotropy energy density and the volume of the nanoparticle. TB ∼ k1V/30 K serves as a practical definition of blocking temperature for a measurement time of ∼1000 s.
- C. R. Vestal and J. Z. Zhang, Chem. Mater., 2002, 14, 3817 CrossRef CAS.
Footnote |
| † Electronic supplementary information (ESI) available: CD data and complete synthesis of nanoparticles. See DOI: 10.1039/b613887j |
| This journal is © The Royal Society of Chemistry 2007 |
