Quantitative detection of protein expression in single cells using droplet microfluidics†
A.
Huebner
ab,
M.
Srisa-Art
c,
D.
Holt
a,
C.
Abell
a,
F.
Hollfelder
b,
A. J.
deMello
c and
J. B.
Edel
cd
aDepartment of Chemistry, University of Cambridge, Lensfield Road, Cambridge, UK CB2 1EW
bDepartment of Biochemistry, University of Cambridge, 80 Tennis Court Road, Cambridge, UK CB2 1GA. E-mail: fh111@cam.ac.uk
cDepartment of Chemistry, Imperial College London, South Kensington, UK SW7 2AZ. E-mail: a.demello@imperial.ac.uk
dInstitute of Biomedical Engineering, Imperial College London, South Kensington, UK SW7 2AZ. E-mail: joshua.edel@imperial.ac.uk
First published on 26th January 2007
Abstract
We demonstrate that single cells can be controllably compartmentalized within aqueous microdroplets; using such an approach we perform high-throughput screening by detecting the expression of a fluorescent protein in individual cells with simultaneous measurement of droplet size and cell occupancy.
In vitro-compartmentalisation presents a new paradigm for biological experimentation.1–4 Pioneering work by Griffiths and Tawfik demonstrated how aqueous microdroplets in an oil carrier phase could be used to link genotype and phenotype in experiments that led to the selection of novel enzymes with altered specificity or enhanced activity.5,6 Subsequent studies have shown that droplets can be generated and manipulated in microfluidic channels at high speeds and with high detection efficiencies.7–10
Water-in-oil droplets within microfluidic channels have the potential to serve as isolated reaction compartments, just like natural cells. Their femtolitre volumes minimise sample consumption and eliminate dispersion of substrates or products. Moreover droplets can be generated at frequencies in excess of 1 kHz and fused with other droplets with chaotic advection within droplets allowing ultra-fast mixing of the dosed reagents. These characteristics make microdroplets in microfluidic channels ideal reaction compartments for many biological experiments,9 including potentially experiments with cells. For example, by entrapping individual cells in droplets, proteins secreted from a cell remain associated with it, and open up the prospect of single cell screening of an expressed protein for directed evolution. Previously, direct fluorescence activated cell sorting (FACS) has been used for directed evolution, but such methods are limited to situations where a positively-charged reaction product happens to bind to the negatively-charged cell membrane.11–13 Aharoni et al. overcame this limitation by sorting cells in water/oil/water double emulsions14 that maintain the reaction product in the same compartment as the cell producing it by FACS to evolve a thiolactonase.
Transferring this approach to microfluidics has the following advantages: (a) droplets generated in microfluidics are less polydisperse than those generated in bulk.15,16 The well-defined droplet size facilitates quantitative analysis of concentration changes in the droplet and thus allows more stringent screening. (b) Droplets can be steered through microfluidic circuits, and additional reagents added in situ by droplet fusion. Interfacing with analytical techniques then allows simultaneous measurement of droplet size and fluorescence with higher precision than FACS. An initial demonstration of these ideas has recently been provided by He et al., who report the selective encapsulation of single cells in picolitre- and femtolitre-volume droplets,17 and Tan et al., who present a vesicle formation method that can control encapsulation of biological species.18 In this paper we extend these proof-of-principle experiments and describe the preparation of microdroplets containing few or individual cells, by detecting the expression of a fluorescent protein in the cell with simultaneous measurement of droplet size, fluorescence and cell occupancy. Such an approach allows high-throughput protein expression and relative quantitation of the expressed protein in a highly uniform and reproducible manner.
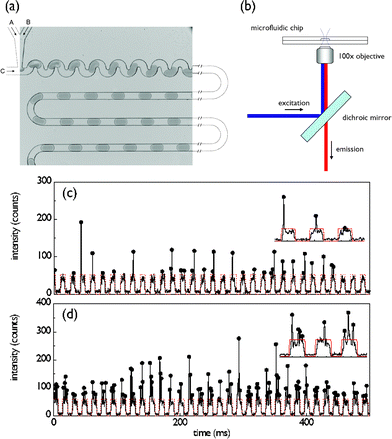
Fig. 1a shows the image of a planar polydimethylsiloxane (PDMS) microfluidic device used in the current experiments.4 In the current experiments two aqueous streams were used to precisely control the number of E. coli cells that expressed yellow fluorescent protein.19 To achieve this, one inlet is loaded with a cell suspension (∼108 cells ml−1, A600 nm ∼ 0.5) in Luria–Bertani broth (LB medium) and the second inlet with an LB medium only. Through variation of the fractional volumetric flow rates between these two channels it was possible to vary the cell occupancy in each droplet. The droplet profile was extracted optically using a confocal laser induced fluorescence detection system as shown in Fig. 1b. The system is capable of resolving single fluorophore events at frequencies in excess of 100 KHz.
 | ||
| Fig. 1 (a) Optical image of the PDMS device for producing uniformly sized and spaced aqueous droplets. The 50 µm square fluidic channel network consists of 3 inlets and one outlet. Two of the inlets (A, B) are used to deliver aqueous solutions and the third (C) delivers the water immiscible oil phase. The volumetric flows are controlled using precision syringe pumps. (b) Schematic of the laser induced fluorescence optical setup. (c,d) Optical readout of 0.5 s traces recorded, along with insets, under low (cell suspension: 0.3 µl min−1, LB: 2.7 µl min−1) and high (cell suspension: 2.1 µl min−1, LB: 0.9 µl min−1) cell loading conditions. Each arch-shaped signal corresponds to the weakly fluorescent LB medium that forms the aqueous droplet. Droplets containing cells are distinguished by a vertical spike arising from the expressed fluorescent protein. | ||
Typical examples of fluorescence readout under low and high cell occupancy per droplet are shown in Figs. 1c and 1d over a timescale of less than a second. Importantly the LB medium acts as a weakly fluorescing background defining the aqueous droplet boundaries (SNR = 9), whilst distinct photon bursts, corresponding to the presence of individual cells, can be distinguished on top of this background. The LB fluorescent background is characterised by an approximately rectangular cross-section (marked by the red dotted line). The full width half maximum (FWHM) of fluorescent bursts arising from E. coli cells is 30-fold shorter than the background droplet events, which is consistent with the relative length of droplets (40 µm, corresponding to a volume of 30 femtolitres) and E. coli cells (1.5–2.0 µm).
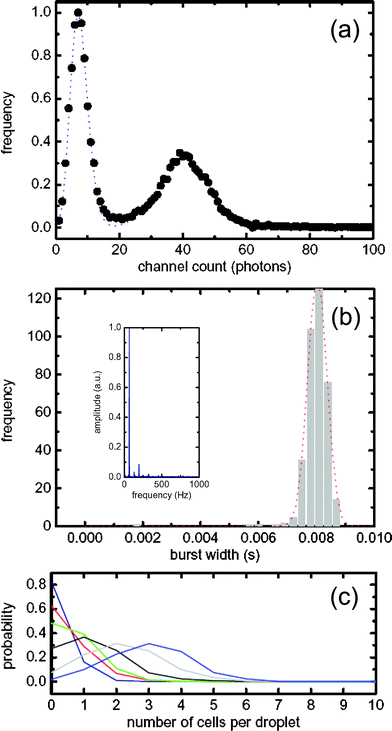
The uniformity of droplet size and the reproducibility in their rate of formation can be assessed by performing a Fourier transform of the time-domain fluorescent readout. An example of such an analysis is shown in the inset of Fig. 2(b) for an acquisition period of 60 s. The greater the variation in droplet size and droplet generation rates, the broader the FWHM of the FT. The droplet frequency was 60 Hz with a FWHM less than 1 Hz, indicating a polydispersity less than 5%.
 | ||
| Fig. 2 (a) Photon burst threshold distributions. The shot noise Poissonian distribution has a threshold level of 16 counts and the cellular/LB Gaussian threshold distribution has a value of 56. (b) Droplet width distribution. Inset: Fourier transform of a typical time trace for droplet generation. (c) Probability distribution for cellular occupancy within single droplets. The cell suspension and LB medium, going from low to high cell loading condition, had volumetric flow rates of (Blue 0.3 µl min−1, 2.7 µl min−1), (Red 0.6 µl min−1, 2.4 µl min−1), (Green 0.9 µl min−1, 2.1 µl min−1), (Black 1.5 µl min−1, 1.5 µl min−1), (Grey 1.8 µl min−1, 1.2 µl min−1), (Light blue 2.1 µl min−1, 0.9 µl min−1). | ||
Errors associated with false positives can be significantly reduced by correct threshold selection when determining droplet and cell location. For this, a modified single molecule burst scan approach is utilized. A photon counting histogram (PCH) as shown in Fig. 2a was used as the starting point for determining an appropriate threshold for a given data set. Since the background shot noise exhibits Poissonian statistics,20 the early part of the PCH dominated by low, background counts is modelled to a Poisson distribution, which then sets a statistical limit for the droplet threshold. Photon counting events above this threshold were identified as droplets. By analogy with Gaussian systems the selected peak discrimination threshold can be defined as three standard deviations from the mean count background rate nshot,
| nshot = μ + 3√μ |
Adoption of a threshold that lies three standard deviations above the mean yields a confidence limit that is typically greater than 99%. In the example shown, the background shot noise threshold is calculated to be 16 counts per bin. The second component of the PCH is defined as the cell distribution and can be approximated to be Gaussian in nature.21 This threshold value nd was determined by the mean (μ′) and standard deviation (σ) calculated from the Gaussian fit,
| nd = μ′ + 1.5σ |
In the example shown this value was determined to be 56 counts per bin. As such, nshot was used to determine droplet boundaries and nd was used as the threshold to extract cellular information. Using these defined thresholds, individual droplet widths were determined. In Fig. 2b droplets have a mean residence time of 7.5 ms and a relative standard deviation of 5%. The distribution itself is Gaussian in nature and the small FWHM correlates closely with the high level of inter-droplet uniformity. The residence time can be converted to a spatial dimension by accounting for the linear flow velocity within the fluidic channel. In the current data the flow velocity was 50 mm s−1 and hence the droplet width was calculated to be 40 µm. In general, cells have a residence time within the detection probe volume of between 200–500 µs, yielding an average estimated size of 1.9 µm.
Fig. 2c shows a probability distribution describing the number of cells per individual droplet. Cell occupancy is controlled by varying the ratio between the cell and LB streams, and tuneable between 1–6 cells per droplet. For example, under low cell loading conditions the instantaneous occupation probabilities are 83% (for an empty droplet), 16% (for single occupancy) and 1% (for double occupancy). Under high cell loading conditions the instantaneous occupation probabilities are 10, 23, 31, 25, 7, and 2% (for one to six cells per droplet, respectively). This corresponds to a Gaussian distribution of cell occupancy with a mean of 3 cells per droplet.
When performing single cell analysis within single droplets, a detection occupancy of either 0 or 1 cells per droplet is ideally required. Since we are able to generate droplets extremely quickly (limited only by the acquisition rate), the occurrence of empty droplets does not limit analytical throughput. This concept closely mimics considerations in single molecule photon burst spectroscopy where the aim is to maximize the probability of having either 0 or 1 molecule within the detection probe volume.22 We show here that this can essentially be achieved with confined cellular populations. This is significant for future applications of droplet technology in directed evolution, where the ability to make ‘monoclonal’ droplets will be especially important.
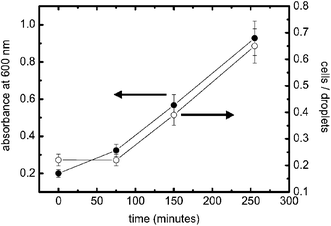
To demonstrate the potential utility of the approach for expression studies we used the system to monitor growth of E. coli (grown at 37 °C, 225 rpm) expressing the yellow fluorescent protein mutant ‘Venus’.19 The data shown in Fig. 3 were recorded and compared with data obtained by standard absorbance measurements (analysing sample turbidity at 600 nm). The fluorescence measurements in the cell compare well with absorbance measurements and demonstrate utility for monitoring and analyzing cell growth in bulk. We expect that this technique will allow the study of cell populations at different stages of their growth and under different environmental conditions such as pH, amount of nutrition, cell densities or in the presence of added molecules.
 | ||
| Fig. 3 Growth curves of E. coli expressing the fluorophore ‘Venus’ analysed with standard turbidity (black circles) and within microdroplets (white circles). Cell density in bulk (measured at A 600 nm) and cell occupancy in droplets (number of cells/total number of droplets) show that the level of expressed fluorescent protein increases similarly over time, indicating that the measurement in droplets faithfully reflects the expression and growth state. To validate our results we measured each sample for more than 120 s using PBS–LB (1 : 1 v/v) only for the second inlet. The flow rate was 2.0 µl min−1 for the cell sample and 1.0 µl min−1 for the second inlet. Microdroplet data are calculated by averaging multiple droplet events. | ||
In conclusion, we have demonstrated that single cells can be controllably compartmentalized within aqueous microdroplets. Moreover, we have demonstrated that our high-throughput screen allows us to compare single cell vs. cell–cell or even cell-subpopulations within well defined compartments. The demand for such technology is well recognised.23 This approach has the potential to impact on the study of many biological systems and opens the door to future high-throughput single cell assays with sample throughputs in excess of 107 per day.
Financial support by the RCUK Basic Technology Programme and the EU Early Stage Training Site ChemBioCam is gratefully acknowledged.
Notes and references
- D. S. Tawfik and A. D. Griffiths, Nat. Biotechnol., 1998, 16, 652 CrossRef CAS.
- A. D. Griffiths and D. S. Tawfik, Trends Biotechnol., 2006, 24, 395 CrossRef CAS.
- O. J. Miller, K. Bernath, J. J. Agresti, G. Amitai, B. T. Kelly, E. Mastrobattista, V. Taly, S. Magdassi, D. S. Tawfik and A. D. Griffiths, Nat. Methods, 2006, 3, 561 CrossRef CAS.
- H. M. O'Hare and K. Johnsson, Chem. Biol., 2005, 12, 1255 CrossRef CAS.
- H. M. Cohen, D. S. Tawfik and A. D. Griffiths, Protein Eng. Des. Sel., 2004, 17, 3 Search PubMed.
- A. D. Griffiths and D. S. Tawfik, Embo J., 2003, 22, 24 CrossRef CAS.
- M. R. Bringer, C. J. Gerdts, H. Song, J. D. Tice and R. F. Ismagilov, Philos. Trans. R. Soc. London, Ser. A, 2004, 362, 1087 CrossRef CAS.
- H. Song, J. D. Tice and R. F. Ismagilov, Angew. Chem., Int. Ed., 2003, 42, 768 CrossRef CAS.
- D. L. Chen and R. F. Ismagilov, Curr. Opin. Chem. Biol., 2006, 10, 226 CrossRef CAS.
- H. Leemhuis, V. Stein, A. D. Griffiths and F. Hollfelder, Curr. Opin. Struct. Biol., 2005, 15, 472 CrossRef CAS.
- M. J. Olsen, J. Gam, B. L. Iverson and G. Georgiou, in Directed Enzyme Evolution: Screening and Selection Methods, ed. F. H. Arnold, G. Georgiou, Humana Press, Totowa, NJ, 2003, vol. 230, p. 329 Search PubMed.
- P. S. Daugherty, B. L. Iverson and G. Georgiou, J. Immunol. Methods, 2000, 243, 211 CrossRef CAS.
- N. Varadarajan, J. Gam, M. J. Olsen, G. Georgiou and B. L. Iverson, Proc. Natl. Acad. Sci. U. S. A., 2005, 102, 6855 CrossRef CAS.
- A. Aharoni, G. Amitai, K. Bernath, S. Magdassi and D. S. Tawfik, Chem. Biol., 2005, 12, 1281 CrossRef CAS.
- M. Hai, K. Bernath, D. Tawfik and S. Magdassi, Langmuir, 2004, 20, 2081 CrossRef CAS.
- K. Bernath, M. Hai, E. Mastrobattista, A. D. Griffiths, S. Magdassi and D. S. Tawfik, Anal. Biochem., 2004, 325, 151 CrossRef CAS.
- M. He, J. S. Edgar, G. D. M. Jeffries, R. M. Lorenz, J. P. Shelby and D. T. Chiu, Anal. Chem., 2005, 77, 1539 CrossRef CAS.
- Y.-C. Tan, K. Hettiarachchi, M. Siu, Y.-R. Pan and A. P. Lee, J. Am. Chem. Soc., 2006, 128, 5656 CrossRef CAS.
- T. Nagai, K. Ibata, E. S. Park, M. Kubota, K. Mikoshiba and A. Miyawaki, Nat. Biotechnol., 2002, 20, 87 CrossRef CAS.
- S. M. Stavis, J. B. Edel, Y. G. Li, K. T. Samiee, D. Luo and H. G. Craighead, Nanotechnology, 2005, 16, S314 CrossRef.
- M. Foquet, J. Korlach, W. Zipfel, W. W. Webb and H. G. Craighead, Anal. Chem., 2002, 74, 1415 CrossRef CAS.
- E. K. Hill and A. J. deMello, Analyst, 2000, 125, 1033 RSC.
- D. N. Breslauer, P. J. Lee and L. P. Lee, Mol. BioSyst., 2006, 2, 97 RSC.
Footnote |
| † Electronic supplementary information (ESI) available: Experimental details. See DOI: 10.1039/b618570c |
| This journal is © The Royal Society of Chemistry 2007 |
