Melting of palladium clusters—Canonical and microcanonical Monte Carlo simulation
Received 4th September 2002, Accepted 31st October 2002
First published on 18th November 2002
Abstract
We present Monte Carlo simulations of single palladium clusters of 13, 34, 54, 55, 147 and 309 atoms. The clusters are modeled by a many-body potential and they have been simulated at constant temperature or constant total energy. The caloric curves of the clusters, with the exception of Pd34, exhibit an S-bend at melting which is typical for a finite system. We have also observed the typical coexistence region of solid and molten clusters both in the canonical and the microcanonical ensembles. Pd34, in contrast, melts without an accompanying peak in heat capacity and at melting the atoms become mobile without any significant change in geometric structure. For the larger clusters a free energy barrier inhibits phase switching. In some cases of phase change from molten to solid structure the barrier is of purely entropic character. By a conversion of the results in the microcanonical simulations into temperature-dependent data, the simulations at fixed temperature and fixed total energy have been compared. The agreement is in most cases good. The results are furthermore compared to earlier molecular dynamics simulations with the Nosé–Hoover thermostat. These results are in good agreement with the Monte Carlo simulations as well.
I. Introduction
During the last three decades, keen interest has been shown in investigation of the melting of clusters, mainly computationally but also experimentally. The reasons are manifold. In the field of experimental cluster research, a knowledge of the thermal state of free clusters at different temperatures is of importance. But perhaps the main interest is to gain more fundamental understanding of the melting phenomenon, not only for finite systems, but also for bulk. Fundamental theories about cluster melting were developed in, e.g., refs. 1–6 and a large number of simulation studies have confirmed the theories.7–13 One of the striking differences between cluster and bulk is that clusters exhibit a melting temperature interval obeying the rule that the smaller the cluster, the longer the interval.14 In this interval, the solid and molten phases coexist. The coexistence might be described by an equilibrium constant of the ratio between the number of clusters being solid and molten, respectively, in an ensemble. Small clusters are entirely solid or molten at a given moment while larger ones, as for instance Au459, approach the behavior of bulk, i.e., a fraction of a single cluster might be molten and a fraction might be solid simultaneously.15 As the most mobile atoms in the cluster are the ones at the surface, the melting usually starts at the surface. Whether surface melting is a phase transition separate from the overall melting has been a topic of debate (see e.g.refs. 11 and 13).Finite melting temperature intervals have been observed in experiments as well. The experimental work that has drawn most attention is the work of the Haberland group at Universität Freiburg.16–18 In their approach, size-selected clusters assume a desired temperature by passing a heat bath of rare gas. Subsequently, a photofragmentation pattern is recorded. The temperature of the clusters can be increased either by injecting a known amount of photon energy after the heat bath or by increasing the heat bath temperature. When the photofragmentation patterns match, the photon energy corresponds to the temperature increase and the heat capacity can be calculated. In previous publications,19–21 we verified by simulation the assumption that the clusters collide sufficiently many times with the rare gas atoms to adopt the heat bath temperature. The caloric curves of sodium clusters that were obtained by the Haberland group confirm that solid and molten cluster phases coexist within a finite temperature interval. Accurate simulations of sodium clusters are however difficult to perform since a good model potential is still missing.
Interestingly, many different methods have been used for simulation of clusters, like molecular dynamics (MD) with fixed energy,14 MD with Nosé–Hoover thermostat or a rare gas heat bath,22 Monte Carlo (MC) with fixed temperature23 and fixed total energy,24,25 j-walking MC8 and parallel tempering MC.9 Also, molecular dynamics simulations with the internuclear forces calculated using density functional theory have now been reported.26 Furthermore, simulations aiming to obtain the free energy or the density of states like the finite-time variation method10 are also found in the literature. A majority of the publications are on Lennard-Jones clusters. The most frequently investigated cluster sizes are the icosahedrally shaped ones, but also other, e.g. cuboctahedral, clusters have been simulated.27
The most common way to simulate thermal properties of an ensemble of clusters is to simulate one cluster which is isolated and prevented from fragmentation (evaporation). However, Rytkönen et al.11,28 have shown that in a true picture of the thermal behavior of clusters, it is necessary to take into account the adsorption and desorption of cluster atoms, not only in principle, but also in practice for some clusters. Rytkönen et al. found in simulations that argon clusters with more than 309 atoms start to fragment already below the estimated melting temperature. As a solution to the problem, they performed simulations of clusters in equilibrium with its vapor. They did however find that for materials with a very low vapor pressure, such more complicated simulations are not necessary. Support for simulations of metal clusters without vapor is found in the recent publication by Moseler and Nordiek8 They simulated clusters with the pairwise atomic interaction represented by the Morse potential and found that the shorter the range of the potential the smaller was the temperature difference between melting and boiling. The noble gases have short-range interactions and the trend can be exemplified by the fact that the melting and boiling temperatures of bulk xenon are very close to each other (161 K and 165 K, respectively). Metal clusters, on the other hand, having a relatively large interaction range, are stable in the molten phase without significant desorption of atoms in a rather broad temperature interval.
In this work we have used the MC method to simulate a palladium cluster with a fixed temperature (canonical) or a fixed total energy (microcanonical). In the simulations, we have calculated properties such as the potential energy at various temperatures and total energies, respectively. In both ensembles, the potential energy as well as other properties, exhibit significant changes upon melting and the temperature interval and the total energy interval, respectively, where melting occurs can be identified.
The fragmentation problem has been treated differently in the two ensembles. In the microcanonical ensemble, fragmentation is impossible at total energies lower than the removal energy of one atom. This energy is however lower than the energy required for melting. Thus, fragmentation of a solid cluster is in principle possible. In our simulations fragmentation of the clusters has only been observed at energies well above the melting energy, although the simulations of the molten clusters have lasted sufficiently long to accurately probe the phase space of the molten phase. In the calculations and the results of this paper, we have only included simulations at energies lower than that of the lowest-energy simulation that led to fragmentation. In the canonical simulation fragmentation is an inevitable result at all temperatures above zero if the simulation proceeds sufficiently long. One measure to prevent fragmentation is to confine the cluster in a sphere. Such a method may however favor a spherical shape of the cluster. Here we present a method to prevent the cluster from fragmentation without favoring spherical shape. Only cluster configurations where it is possible to move from any atom to any other atom via a chain of connected atoms are regarded as non-fragmented. Any fragmented configuration is rejected. This method works well but is perhaps unnecessary for the strongly bound palladium clusters. Fragmentation attempts occurred only at temperatures well above the melting temperature.
One aim of this work is to study the similarities and differences between canonical and microcanonical MC techniques. For an infinite system the two ensembles are identical in the sence that the temperature corresponds to an exact total energy. For a finite system in the canonical system, however, the total energy is distributed and the results from the different ensembles cannot be compared directly. But using the density of states (DOS), microcanonical data may be converted into temperature-dependent data. The DOS is not known for the systems that we have simulated, but we have used a two-state model for the DOS that accurately reproduces the caloric curves of the palladium clusters. When using MC simulation of small clusters, both Gallego et al.24 and Grimson25 found differences between the canonical and microcanonical ensembles in the melting region. In our most accurate simulations (Pd13) we have not found any evidance for differences between the ensembles.
Our simulation results are also compared to those obtained in a previous work by our colleagues Grönbeck et al.22 They investigated the melting point of palladium clusters using MD simulations with the Nosé–Hoover thermostat.29 In relation to their earlier work we shall not only be able to introduce interesting methodological alternatives but also extend both the set of clusters studied and the precision of the simulations so that new results can be obtained. In this way we shall be able to partially support and otherwise modify the picture of the properties of small palladium clusters in the vicinity of the melting/freezing transition obtained in their early exploratory study.
Although simulations are successful in describing the qualitative and quantitative thermal behavior of the clusters outside the coexistence region, it has become evident that the free energy barrier between the phases may prevent an accurate determination of the melting temperature.30,31 A second focus of this work is the character of the free energy barrier between the solid and molten phases. This barrier is a problem of considerable importance, not only for simulations of melting in clusters, but also for simulations of melting in bulk32,33 and in general for simulations of any systems with several comparable deep local free energy minima.
The article is organized as follows: In Sec. 2 we present the computational and simulation details. In Sec. 3 we discuss a model for the density of states which we use for qualitative and quantitative interpretation of the simulation results. The conversion of data from microcanonical simulation to temperature-dependent data is derived in Sec. 4. In Sec. 5 we present the results for the icosahedral clusters with a discussion of the free energy phase barriers. Results for the non-symmetrical clusters are given in Sec. 6 and conclusions are drawn in Sec. 7.
II. Monte Carlo simulation of clusters
The system of our concern is a low-pressure gas of single-sized palladium clusters. Such a gas would not be stable in a chamber since when clusters collide with each other or with the chamber wall, they readily exchange atoms so that the monodisperse nature of the gas is lost. In contrast, free clusters are experimentally mostly studied in cluster beams in vacuum. In the supersonic beam often used in cluster experiments,34 the translational and rotational temperatures are considerably cooled.35,36 Thus the vibrations are not in equilibrium with the rest of the degrees of freedom. Still, the cluster gas is a convenient system to simulate and since the translational motion is independent of that of the internal degrees of freedom, simulation results may be converted from one to other translational temperatures. Furthermore, one may expect the rotational energy to couple weakly with the vibrations. The simulations are concerned with the vibrations of the cluster. Thus the simulation results at one vibrational temperature could be combined with any translational temperature and rotational temperature. The results presented below refer to the cluster, inclusive of translation and rotation, with totally equilibrated degrees of freedom.Since the pressure is assumed to be very low, the clusters encounter each other very rarely. Each cluster can therefore be regarded as a microcanonical system. As an alternative to the study of a canonical ensemble of clusters, it might be of equal relevance to study the properties of a microcanonical ensemble of single clusters. However, the temperature dependence of properties is usually more relevant than energy dependence in experiments. Hence, a conversion of microcanonical simulation data to canonical form is appropriate for practical use. In this paper the conversion is performed to test the correspondence of the two ensembles.
A. Monte Carlo simulation of clusters at fixed temperature
By means of simulation, we have investigated how properties, as for instance the potential energy, of free clusters with N atoms per cluster evolve with the temperature T where T varies from 50 K to 2000 K. Since the clusters are at a very low pressure, we can assume that they never collide with each other. Thus, each cluster is an isolated system with a fixed total energy. In the canonical ensemble of such clusters, the energy is thermally distributed. Let us now use one cluster to represent the whole ensemble of clusters. Then the spatial configurations of the cluster, R![[thin space (1/6-em)]](https://www.rsc.org/images/entities/char_2009.gif) =
=![[thin space (1/6-em)]](https://www.rsc.org/images/entities/char_2009.gif) (x1,y1,z1,x2,…,zN), represent the distribution for the whole canonical ensemble. The distribution is given by the Boltzmann factor,
(x1,y1,z1,x2,…,zN), represent the distribution for the whole canonical ensemble. The distribution is given by the Boltzmann factor,| | probability(R)![[thin space (1/6-em)]](https://www.rsc.org/images/entities/char_2009.gif) ∝ ∝![[thin space (1/6-em)]](https://www.rsc.org/images/entities/char_2009.gif) exp(−U(R)/kBT), exp(−U(R)/kBT), | (1) |
where U is the potential energy of the single cluster and kB is Boltzmann's constant. The momenta and kinetic energy need not be considered as the potential and kinetic energies are separable in the canonical ensemble and the momenta will contribute to the energy simply by Ekin![[thin space (1/6-em)]](https://www.rsc.org/images/entities/char_2009.gif) =
=![[thin space (1/6-em)]](https://www.rsc.org/images/entities/char_2009.gif) 3NkBT/2.
3NkBT/2.Besides the temperature and the number of atoms, the volume of the system should be fixed in the canonical ensemble. As the cluster gas is assumed to be ideal, the volume per cluster should be large or even infinite. A fundamental problem is that in an infinite volume, the equilibrium state of the single cluster described by eqn. 1 corresponds to all cluster atoms having evaporated from the cluster for all T![[thin space (1/6-em)]](https://www.rsc.org/images/entities/char_2009.gif) >
>![[thin space (1/6-em)]](https://www.rsc.org/images/entities/char_2009.gif) 0 (cf.refs. 11 and 28). The reason is that although the Boltzmann factor might be considerably larger for the minimum energy configuration than for fragmented configurations, the volume of the phase space corresponding to fragmented configurations is infinite. In order to avoid the inevitable fragmentation, the standard Metropolis Monte Carlo method37 therefore has to be modified so that a move of an atom that leads to fragmentation is rejected. Hence, we define the average value of, for instance, the potential energy at the temperature T as
0 (cf.refs. 11 and 28). The reason is that although the Boltzmann factor might be considerably larger for the minimum energy configuration than for fragmented configurations, the volume of the phase space corresponding to fragmented configurations is infinite. In order to avoid the inevitable fragmentation, the standard Metropolis Monte Carlo method37 therefore has to be modified so that a move of an atom that leads to fragmentation is rejected. Hence, we define the average value of, for instance, the potential energy at the temperature T as
| |  | (2) |
where the sampling is over all configurations
Rthat describe a cluster.
One method to prevent one atom from leaving the cluster is to reject a configuration if any atom is more distant from its nearest neighbor than a user-defined maximal distance. This method does however not prevent an escape of e.g. a dimer from the rest of the cluster. One method to define a cluster that prevents escape of any atom is to require that all atoms have to be within a sphere with fixed radius from the centre of mass.38,39 But with such a definition of a cluster, the shape of the cluster is somewhat constrained, favoring spherical shape. As will be shown in Sec. 5, the shape of molten clusters tend to be non-spherical. Therefore, we have used an alternative definition of a non-fragmented cluster by which the cluster is constrained to be connected but no constraint is put on cluster shape: A configuration of atoms form a cluster if all atoms are linked to all other atoms via a chain of adjacent atoms. Two atoms which are closer to each other than an element-specific limit distance are said to be adjacent. To determine whether a configuration is connected is exactly the problem described in graph theory (see e.g.ref. 40). Our algorithm for separating fragmented configurations from non-fragmented ones is described in the appendix.
The disadvantage of the canonical ensemble is that we have to introduce some kind of extra parameter to distinguish between a cluster and a fragmented cluster. In our case the parameter is the interatomic limit distance for two atoms to be adjacent. However, the interaction between the palladium atoms is so strong that the process to fragment a cluster is very slow due to the low vapor pressure of the cluster.11 Hence, we have seen fragmentation attempts on very few occasions only. In our study, Pd13 is the cluster for which an attempt to fragment occurred at the lowest temperature, which was at 1500 K. This temperature is well above the melting temperature of the cluster. In the appendix we find that a limit of 4.0 Å is a good divisor for fragmented and non-fragmented clusters.
B. Monte Carlo simulation of a cluster at fixed total energy
In the microcanonical MC simulation, the system to simulate is a cluster which is isolated in an infinite volume. The total energy of the cluster is fixed at E. For the sampling of quantities we have used the efficient microcanonical sampling (EMS) method developed by Severin et al.41 A detailed description of this method is also found in ref. 42. A short derivation of the method is given here.One of the fundamental principles of statistical mechanics is that for a system at fixed total energy, all states with this total energy are equally probable. A state is here defined by the spatial coordinates of the cluster atoms R and the momenta of the atoms P![[thin space (1/6-em)]](https://www.rsc.org/images/entities/char_2009.gif) =
=![[thin space (1/6-em)]](https://www.rsc.org/images/entities/char_2009.gif) (px1,py1,pz1,px2,…,pzN). However, no quantities related to the momenta, except the kinetic energy, are of interest in this study. Since the potential energy is sampled and the total energy is fixed, the average kinetic energy is automatically obtained and there is no need for simulating the momenta. At a total energy E, the probability of a spatial configuration R, regardless of momenta, must be proportional to the number of available momentum configurations P, on the condition that the kinetic energy satisfies EK
(px1,py1,pz1,px2,…,pzN). However, no quantities related to the momenta, except the kinetic energy, are of interest in this study. Since the potential energy is sampled and the total energy is fixed, the average kinetic energy is automatically obtained and there is no need for simulating the momenta. At a total energy E, the probability of a spatial configuration R, regardless of momenta, must be proportional to the number of available momentum configurations P, on the condition that the kinetic energy satisfies EK![[thin space (1/6-em)]](https://www.rsc.org/images/entities/char_2009.gif) =
=![[thin space (1/6-em)]](https://www.rsc.org/images/entities/char_2009.gif) E
E![[thin space (1/6-em)]](https://www.rsc.org/images/entities/char_2009.gif) −
−![[thin space (1/6-em)]](https://www.rsc.org/images/entities/char_2009.gif) U. The number of momentum configurations is proportional to the density of momentum states,
U. The number of momentum configurations is proportional to the density of momentum states,
| | ΩK(EK)![[thin space (1/6-em)]](https://www.rsc.org/images/entities/char_2009.gif) = =![[thin space (1/6-em)]](https://www.rsc.org/images/entities/char_2009.gif) constant constant![[thin space (1/6-em)]](https://www.rsc.org/images/entities/char_2009.gif) × ×![[thin space (1/6-em)]](https://www.rsc.org/images/entities/char_2009.gif) E3N/2−1K. E3N/2−1K. | (3) |
Thus, the probability of a spatial configuration
R satisfies
| | probability(R)![[thin space (1/6-em)]](https://www.rsc.org/images/entities/char_2009.gif) ∝ ∝![[thin space (1/6-em)]](https://www.rsc.org/images/entities/char_2009.gif) (E (E![[thin space (1/6-em)]](https://www.rsc.org/images/entities/char_2009.gif) − −![[thin space (1/6-em)]](https://www.rsc.org/images/entities/char_2009.gif) U(R))3N/2−1. U(R))3N/2−1. | (4) |
Standard Metropolis Monte Carlo simulation
37 can now be used. One atom at a time is moved a small distance and the new spatial configuration is accepted if
| |  | (5) |
where
S[0,1] is a uniform random number between zero and one.
C. The many-body alloy potential
The interaction between the atoms in the cluster is described by the many-body alloy potential, developed by Tománek and co-workers.43 The potential energy of the cluster is written as a sum over all atoms in the cluster| |  | (6) |
where| |  | (7) |
Here rij is the distance between atoms i and j. The repulsive part of the binding energy is considered to be pairwise and of Born–Mayer type. The attractive part is modeled by a tight-binding second-moment approximation of the d band density of states. This model leads to a many-body character of the attractive part of the interaction. The parameters that we use were calculated by Tománek et al.43 by fitting the energy to LDA calculations of totally frozen bulk palladium. The parameter values are ξ0![[thin space (1/6-em)]](https://www.rsc.org/images/entities/char_2009.gif) =
=![[thin space (1/6-em)]](https://www.rsc.org/images/entities/char_2009.gif) 1.2630 eV, ε0
1.2630 eV, ε0![[thin space (1/6-em)]](https://www.rsc.org/images/entities/char_2009.gif) =
=![[thin space (1/6-em)]](https://www.rsc.org/images/entities/char_2009.gif) 0.08376 eV, r0
0.08376 eV, r0![[thin space (1/6-em)]](https://www.rsc.org/images/entities/char_2009.gif) =
=![[thin space (1/6-em)]](https://www.rsc.org/images/entities/char_2009.gif) 2.758 Å, p
2.758 Å, p![[thin space (1/6-em)]](https://www.rsc.org/images/entities/char_2009.gif) =
=![[thin space (1/6-em)]](https://www.rsc.org/images/entities/char_2009.gif) 14.8 and q
14.8 and q![[thin space (1/6-em)]](https://www.rsc.org/images/entities/char_2009.gif) =
=![[thin space (1/6-em)]](https://www.rsc.org/images/entities/char_2009.gif) 3.40. These parameter values were also used in the work by Grönbeck et al.22 with which we compare our results. This potential compares favorably with SCF-CI calculations of the optimized geometry44 for finite systems like Pd13. The mean radius of the icosahedral structure of Pd13 is with SCF-CI 2.60 Å and with the many-body alloy potential 2.50 Å. Moreover, the energy difference between the icosahedral and octahedral isomers is 0.12 eV with both techniques.
3.40. These parameter values were also used in the work by Grönbeck et al.22 with which we compare our results. This potential compares favorably with SCF-CI calculations of the optimized geometry44 for finite systems like Pd13. The mean radius of the icosahedral structure of Pd13 is with SCF-CI 2.60 Å and with the many-body alloy potential 2.50 Å. Moreover, the energy difference between the icosahedral and octahedral isomers is 0.12 eV with both techniques.It must be mentioned that other sets of parameters for this potential and palladium have been used by others. For instance, Rey and coworkers45 used other parameters and therefore obtained another melting temperature (816 K) for Pd13 to be compared with 1110 K for Pd13 with our parameters.
D. Simulation details
1. Simulation at fixed temperature. Three kinds of simulation have been performed. The first kind was carried out at fixed temperature and is referred to as MC-CAN. They are run in the following way: the cluster is prepared in a configuration which is equal or close to the minimum-energy configuration. For the icosahedral clusters, Pd13, Pd55 and Pd147, this is accomplished by starting in a near-icosahedral structure and subsequently finding the minimum in potential energy by using a steepest-descent method. For Pd34 and Pd54, there are probably many configurations with an energy close to the global minimum. By an annealing procedure, the molten clusters were brought to 1 K and then a steepest-descent search was started. For Pd54, the minimum-energy configuration that was found is simply the icosahedral structure of Pd55 with one outer atom removed. For Pd34, the minimum-energy configuration that we found has five core atoms and one surrounding non-spherical shell with 29 atoms.A simulation is started by letting the minimum-energy configuration approach equilibrium at desired temperature. New configurations are generated by letting the atoms move randomly one by one with a small maximal displacement. During the meltdown stage of the simulation when no statistics are collected, an algorithm is used to adjust the maximal displacement aiming at finding a value which will lead to a rejection of approximately half the generated configurations during the succeeding sampling according to standard Monte Carlo technique.46 The maximal displacement was changed ten times during the meltdown and thereafter held constant in the main part of the simulation. In addition to the rejection due to a small Boltzmann factor, trial configurations are rejected if they form fragmented clusters in accordance to Sec. 2.A. The meltdown part of the simulation was run for about 1 million to 3 million single-atom move attempts (“steps”) depending on cluster size.
After the meltdown, quantities such as the potential energy are sampled for a number of steps. During the sampling period the maximal displacement was kept at a fixed value based on the rejection rates obtained during meltdown. The resulting rejection rate during the sampling period was confirmed to fall between 48% and 52% in all the simulations. The number of steps during the sampling varied normally from 10 million to 30 million. In addition to the potential energy, U, the mean distance to the centre of mass, the radii of gyration, the specific heat Cv and the Lindemann index δ were sampled. The mean distance to the centre of mass is defined as
| |  | (8) |
where
xi is the position of atom
i and the centre of mass is
xCM. This quantity can describe a volume expansion of the cluster. The radii of gyration are calculated for the principal axes and are defined as
| |  | (9) |
where
Ii is the moment of inertia along principal axis
i. Note that if all the atoms in the cluster have the same mass, then the total mass of the cluster,
m, is included also in
Ii and is canceled in
ri. For a solid ellipsoid, the relation between the semi-axes
a,
b and
c and the radii of gyration is
| |  | (10) |
| |  | (11) |
| |  | (12) |
Thus, if approximating the cluster with an ellipsoid, the radii of gyration can give information about the shape of the cluster. The quantity
δ measures the fluctuations in distances between atoms and is defined as
| |  | (13) |
If any atoms switch positions in the cluster,
δ will increase drastically and thus a rise in
δ is an indicator of melting.
2. Simulation at fixed total energy. The second kind of simulation was carried out at fixed total energy and is referred to as MC-MICRO. They are run in analogy with the MC-CAN simulations described above. The initial configuration of the clusters were the same as for MC-CAN, i.e., the configurations corresponded approximately to the minimum energy state. In the MC-MICRO simulations the icosahedral cluster Pd309 was included. A meltdown preceded the sampling of properties. The meltdown part was run for about 1 million to 15 million steps depending on cluster size. The number of steps during the sampling varied from 10 million to 50 million. In the coexistence region, some simulations lasted even longer. In the simulations the potential energy, the mean distance to the centre of mass, the radii of gyration and the Lindemann index were sampled. In analogy with the MC-CAN simulations the maximal displacement was adjusted during the meltdown and a fixed maximal displacement was used during the sampling giving approximately 50% rejection of generated configurations.
3. Simulation with annealing temperature. The third kind of simulation was carried out at a constantly decreasing temperature and is referred to as MC-ANNEAL. These simulations are similar to those denoted MC-CAN. However, during the sampling period the temperature is decreased before each MC step by ΔT![[thin space (1/6-em)]](https://www.rsc.org/images/entities/char_2009.gif) =
=![[thin space (1/6-em)]](https://www.rsc.org/images/entities/char_2009.gif) (Tfinal
(Tfinal![[thin space (1/6-em)]](https://www.rsc.org/images/entities/char_2009.gif) −
−![[thin space (1/6-em)]](https://www.rsc.org/images/entities/char_2009.gif) Tinitial)/Ns, where Ns is the number of steps during the sampling. Moreover, the maximal displacement is decreased nine times during the sampling period in order to avoid a too high rejection rate when the temperature is lowered. If ΔT is large, the cluster will transform from a molten phase to a glass-like phase. If ΔT is small enough the cluster might attain the highly symmetric solid structure. The phase switch is however obstructed or even prevented by a free energy barrier.
Tinitial)/Ns, where Ns is the number of steps during the sampling. Moreover, the maximal displacement is decreased nine times during the sampling period in order to avoid a too high rejection rate when the temperature is lowered. If ΔT is large, the cluster will transform from a molten phase to a glass-like phase. If ΔT is small enough the cluster might attain the highly symmetric solid structure. The phase switch is however obstructed or even prevented by a free energy barrier. III. A two-state model for the density of states
In an infinite system, the transition from one phase to another at a given pressure, occurs at a specific temperature, barring any metastabilities. In contrast, for a finite system like the cluster, the solid (s) and molten (m) phases coexist within a certain temperature interval. Jellinek et al.14 concluded that in simulations of Ar13, the time spent between every switch of phase was long enough in order to equilibrate in that phase. Hence we can speak of switches between fully developed phases.The equilibrium between the phases at a fixed temperature can be thought of as a unimolecular reaction equilibrium
| | PdN(s)![[thin space (1/6-em)]](https://www.rsc.org/images/entities/char_2009.gif) ⇌ ⇌![[thin space (1/6-em)]](https://www.rsc.org/images/entities/char_2009.gif) PdN(m), PdN(m), | (14) |
where the equilibrium constant is
| |  | (15) |
Here
Fm![[thin space (1/6-em)]](https://www.rsc.org/images/entities/char_2009.gif)
=
![[thin space (1/6-em)]](https://www.rsc.org/images/entities/char_2009.gif) Um
Um![[thin space (1/6-em)]](https://www.rsc.org/images/entities/char_2009.gif)
−
![[thin space (1/6-em)]](https://www.rsc.org/images/entities/char_2009.gif) TSm
TSm is the Helmholtz free energy of one molten cluster. The partition functions are for single clusters and their form in classical mechanics is
| |  | (16) |
| |  | (17) |
Here
Ωs and
Ωm are the densities of states (DOS) of the solid and molten isomers, respectively.
E0 is the minimal attainable (potential) energy of the cluster. Although the melting occurs over a temperature interval, we define the melting temperature,
TM, as the temperature where the equilibrium constant satisfies
KT![[thin space (1/6-em)]](https://www.rsc.org/images/entities/char_2009.gif)
=
![[thin space (1/6-em)]](https://www.rsc.org/images/entities/char_2009.gif)
1. When the number of atoms increases, the DOS becomes enormous and
KT switches from 0 to ∞ in an infinitesimal temperature interval, in accord with thermodynamics.
An equilibrium between coexisting phases may be established at a fixed total energy as well. The microcanonical equilibrium constant is given by
| |  | (18) |
At a certain total energy the DOS of the two phases are equal. This energy we call the melting energy,
EM.
In previous publications19–21 based on the caloric curves of Grönbeck et al.,22 we proposed the following model for the DOS of the icosahedral clusters Pd13 and Pd55:
| | Ω(E)![[thin space (1/6-em)]](https://www.rsc.org/images/entities/char_2009.gif) = =![[thin space (1/6-em)]](https://www.rsc.org/images/entities/char_2009.gif) Ωs(E) Ωs(E)![[thin space (1/6-em)]](https://www.rsc.org/images/entities/char_2009.gif) + +![[thin space (1/6-em)]](https://www.rsc.org/images/entities/char_2009.gif) Ωm(E) Ωm(E)![[thin space (1/6-em)]](https://www.rsc.org/images/entities/char_2009.gif) ∝ ∝![[thin space (1/6-em)]](https://www.rsc.org/images/entities/char_2009.gif) (E (E![[thin space (1/6-em)]](https://www.rsc.org/images/entities/char_2009.gif) − −![[thin space (1/6-em)]](https://www.rsc.org/images/entities/char_2009.gif) E0)n1 E0)n1![[thin space (1/6-em)]](https://www.rsc.org/images/entities/char_2009.gif) + +![[thin space (1/6-em)]](https://www.rsc.org/images/entities/char_2009.gif) k2(E k2(E![[thin space (1/6-em)]](https://www.rsc.org/images/entities/char_2009.gif) − −![[thin space (1/6-em)]](https://www.rsc.org/images/entities/char_2009.gif) E0)n2, E0)n2, | (19) |
where
E is the total energy of the cluster. The model is motivated by the assumption that the cluster might be in either of two states, one entirely solid structure or one of many entirely molten structures which are assumed to be statistically equivalent. The DOS is then expressed as the sum of independent contributions for the two states. The vibration, translation and rotation of the cluster give rise to power law terms like (
E![[thin space (1/6-em)]](https://www.rsc.org/images/entities/char_2009.gif)
−
![[thin space (1/6-em)]](https://www.rsc.org/images/entities/char_2009.gif) E0
E0)
n, but to account for the anharmonicity of the vibrations, the exponents
n1 and
n2 are adjustable parameters. Although
E0 may be calculated by a search for the ground state configuration of a cluster, it is regarded an adjustable parameter as well. The prefactor
k2 is the last parameter (the prefactor of the solid phase term is arbitrarily set to unity).
A. The temperature-dependent caloric curve
The temperature-dependent caloric equation based on this model will be | | 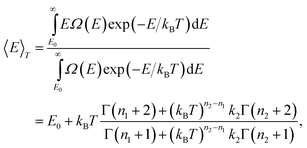 | (20) |
where Γ(x) is the gamma function. At low temperatures, 〈E〉T![[thin space (1/6-em)]](https://www.rsc.org/images/entities/char_2009.gif) −
−![[thin space (1/6-em)]](https://www.rsc.org/images/entities/char_2009.gif) E0
E0![[thin space (1/6-em)]](https://www.rsc.org/images/entities/char_2009.gif) ∼
∼![[thin space (1/6-em)]](https://www.rsc.org/images/entities/char_2009.gif) (n1
(n1![[thin space (1/6-em)]](https://www.rsc.org/images/entities/char_2009.gif) +
+![[thin space (1/6-em)]](https://www.rsc.org/images/entities/char_2009.gif) 1)kBT, and for high temperatures, 〈E〉T
1)kBT, and for high temperatures, 〈E〉T![[thin space (1/6-em)]](https://www.rsc.org/images/entities/char_2009.gif) −
−![[thin space (1/6-em)]](https://www.rsc.org/images/entities/char_2009.gif) E0
E0![[thin space (1/6-em)]](https://www.rsc.org/images/entities/char_2009.gif) ∼
∼![[thin space (1/6-em)]](https://www.rsc.org/images/entities/char_2009.gif) (n2
(n2![[thin space (1/6-em)]](https://www.rsc.org/images/entities/char_2009.gif) +
+![[thin space (1/6-em)]](https://www.rsc.org/images/entities/char_2009.gif) 1)kBT. In-between, the caloric curve of the model DOS exhibits the typical S-shape of melting as seen in the upper panel in Fig. 1. At low temperatures the vibrations in the cluster are harmonic and 〈E〉T
1)kBT. In-between, the caloric curve of the model DOS exhibits the typical S-shape of melting as seen in the upper panel in Fig. 1. At low temperatures the vibrations in the cluster are harmonic and 〈E〉T![[thin space (1/6-em)]](https://www.rsc.org/images/entities/char_2009.gif) −
−![[thin space (1/6-em)]](https://www.rsc.org/images/entities/char_2009.gif) E0
E0![[thin space (1/6-em)]](https://www.rsc.org/images/entities/char_2009.gif) ∼
∼![[thin space (1/6-em)]](https://www.rsc.org/images/entities/char_2009.gif) (3N
(3N![[thin space (1/6-em)]](https://www.rsc.org/images/entities/char_2009.gif) −
−![[thin space (1/6-em)]](https://www.rsc.org/images/entities/char_2009.gif) 3)kBT. However, with increasing T, the atoms start to probe the anharmonicity of the potential and n1
3)kBT. However, with increasing T, the atoms start to probe the anharmonicity of the potential and n1![[thin space (1/6-em)]](https://www.rsc.org/images/entities/char_2009.gif) +
+![[thin space (1/6-em)]](https://www.rsc.org/images/entities/char_2009.gif) 1 will generally be greater than 3N
1 will generally be greater than 3N![[thin space (1/6-em)]](https://www.rsc.org/images/entities/char_2009.gif) −
−![[thin space (1/6-em)]](https://www.rsc.org/images/entities/char_2009.gif) 3. This is even more true for the molten phase and n2/n1 is about 1.3 for Pd13, Pd54, Pd55, Pd147 and Pd309. The fitting parameters in the model DOS are obtained by a least-squares fit of simulation data to the expression in eqn. (20).
3. This is even more true for the molten phase and n2/n1 is about 1.3 for Pd13, Pd54, Pd55, Pd147 and Pd309. The fitting parameters in the model DOS are obtained by a least-squares fit of simulation data to the expression in eqn. (20).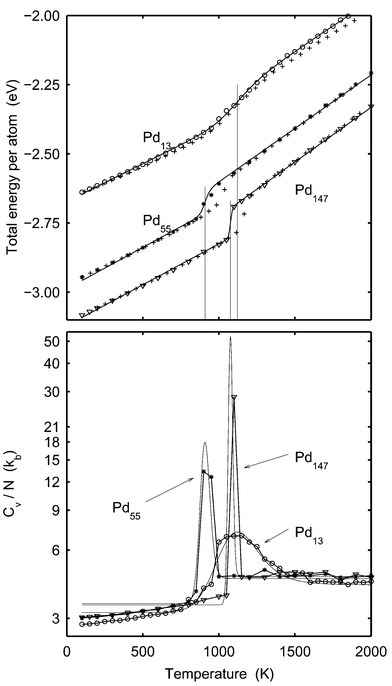 |
| | Fig. 1 Upper panel: The total energy per atom for Pd13
(rings), Pd55
(stars) and Pd147
(triangles)
versusT according to the MC-CAN simulations. The plusses represent the outcome from the MD-NH simulations in ref. 22. The solid lines are the caloric curves given by eqn. (20). The parameters of the model DOS are adjusted to fit the MC-CAN energy data. The vertical lines indicate the melting points given by eqn. (21). From the left, the lines correspond to Pd55, Pd147 and Pd13, respectively. Lower panel: Cv per atom from the MC-CAN simulations of Pd13
(rings), Pd55
(stars) and Pd147
(triangles)
versusT. The solid lines are derived from eqn. (20). NB: logarithmic scale on the ordinate. | |
Using the model DOS in eqn. (19), the melting temperature giving KT![[thin space (1/6-em)]](https://www.rsc.org/images/entities/char_2009.gif) =
=![[thin space (1/6-em)]](https://www.rsc.org/images/entities/char_2009.gif) 1 is
1 is
| |  | (21) |
An alternative way of defining the melting temperature is to use the temperature for which the heat capacity is maximal. The heat capacity is the derivative of
eqn. (20),
| |  | (22) |
For a finite system like a cluster,
Cv does not show a singularity at the melting temperature, but rather a peak of finite width. Employing the model DOS (
eqn. (19)), the maximal heat capacity is obtained when
| |  | (23) |
The difference in melting point determined by
eqns. (21) and (23), respectively, due to the last factor is found to be negligible. One of the advantages using the canonical ensemble is that the heat capacity can be obtained directly from a simulation since it is proportional to the fluctuation in energy:
| |  | (24) |
Eqn. (24) is used for calculating the heat capacities in the lower panel of
Fig. 1 as it is more accurate than using numerical differentiation of the energy in the upper panel of
Fig. 1.
B. The energy-dependent caloric curve
The caloric curve in the microcanonical ensemble is the kinetic energy versus total energy. In order to optimize the parameters we need an analytical expression for 〈EK〉E in the terms of the model. The kinetic energy is | |  | (25) |
where f(EK|E) is the distribution of EK on the condition that the total energy is E. E![[thin space (1/6-em)]](https://www.rsc.org/images/entities/char_2009.gif) −
−![[thin space (1/6-em)]](https://www.rsc.org/images/entities/char_2009.gif) E0 is the available energy that should be distributed among kinetic and potential energies. f(EK|E) may be expressed as an integral over the total coordinate phase space and the total momentum phase space:
E0 is the available energy that should be distributed among kinetic and potential energies. f(EK|E) may be expressed as an integral over the total coordinate phase space and the total momentum phase space:| | 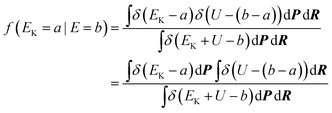 | (26) |
In this section δ is Dirac's delta function. The denominator is proportional to the DOS of the total energy as,| |  | (27) |
Here h is Planck's constant. Let us define the density of states of the kinetic energy and the potential energy47 in analogy with eqn. (27),| |  | (28) |
| |  | (29) |
The constant hK should have the dimension (mass length time−1) and hp the dimension (length). In this derivation the constants hK and hp will always appear as hKhp and the values of the constants may be arbitrary chosen as long as hKhp![[thin space (1/6-em)]](https://www.rsc.org/images/entities/char_2009.gif) =
=![[thin space (1/6-em)]](https://www.rsc.org/images/entities/char_2009.gif) h. With these definitions, the distribution function in eqn. (26) can be written as
h. With these definitions, the distribution function in eqn. (26) can be written as| |  | (30) |
Furthermore, these definitions satisfy the convolution| | 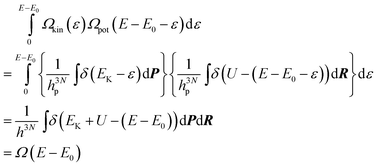 | (31) |
According to the Laplace transform of a convolution we have | | ![[script L]](https://www.rsc.org/images/entities/char_e144.gif) [Ωkin(EK)] [Ωkin(EK)]![[script L]](https://www.rsc.org/images/entities/char_e144.gif) [Ωpot(U)] [Ωpot(U)]![[thin space (1/6-em)]](https://www.rsc.org/images/entities/char_2009.gif) = =![[thin space (1/6-em)]](https://www.rsc.org/images/entities/char_2009.gif) ![[script L]](https://www.rsc.org/images/entities/char_e144.gif) [Ω(E)] [Ω(E)] | (32) |
Since there are 3N momenta contributing to the kinetic energy, the DOS of the kinetic energy is | | Ωkin
(Ek)![[thin space (1/6-em)]](https://www.rsc.org/images/entities/char_2009.gif) ∝ ∝![[thin space (1/6-em)]](https://www.rsc.org/images/entities/char_2009.gif) Ek3N/2−1 Ek3N/2−1 | (33) |
Using the model DOS for Ω(E) in eqn. (19) and the Laplace transform, the model DOS of the potential energy is obtained as | |  | (34) |
Now we have an analytical expression for f(EK|E) in terms of the model and finally, the caloric curve in the microcanonical ensemble according to the model DOS is found to be| |  | (35) |
This model gives a graph of the kinetic energy versus the total energy exhibiting three parts. At low and high total energy, the cluster is entirely solid and entirely molten, respectively. The curve is then linear according to | |  | (36) |
For intermediate energies the two phases of the cluster coexist and the curve performs a wiggle. The expression in eqn. (35) can be fitted to simulation data determining the parameters of the model. When the parameters are calculated, the melting energy according to the model DOS can be calculated from | | Km(EM)![[thin space (1/6-em)]](https://www.rsc.org/images/entities/char_2009.gif) = =![[thin space (1/6-em)]](https://www.rsc.org/images/entities/char_2009.gif) 1 1![[thin space (1/6-em)]](https://www.rsc.org/images/entities/char_2009.gif) ⇔ ⇔![[thin space (1/6-em)]](https://www.rsc.org/images/entities/char_2009.gif) Ωm(EM) Ωm(EM)![[thin space (1/6-em)]](https://www.rsc.org/images/entities/char_2009.gif) = =![[thin space (1/6-em)]](https://www.rsc.org/images/entities/char_2009.gif) Ωs(EM) Ωs(EM)![[thin space (1/6-em)]](https://www.rsc.org/images/entities/char_2009.gif) ⇔ ⇔![[thin space (1/6-em)]](https://www.rsc.org/images/entities/char_2009.gif) (EM (EM![[thin space (1/6-em)]](https://www.rsc.org/images/entities/char_2009.gif) − −![[thin space (1/6-em)]](https://www.rsc.org/images/entities/char_2009.gif) E0)n1 E0)n1![[thin space (1/6-em)]](https://www.rsc.org/images/entities/char_2009.gif) = =![[thin space (1/6-em)]](https://www.rsc.org/images/entities/char_2009.gif) k2(EM k2(EM![[thin space (1/6-em)]](https://www.rsc.org/images/entities/char_2009.gif) − −![[thin space (1/6-em)]](https://www.rsc.org/images/entities/char_2009.gif) E0)n2 E0)n2![[thin space (1/6-em)]](https://www.rsc.org/images/entities/char_2009.gif) ⇔ ⇔![[thin space (1/6-em)]](https://www.rsc.org/images/entities/char_2009.gif) EM EM![[thin space (1/6-em)]](https://www.rsc.org/images/entities/char_2009.gif) = =![[thin space (1/6-em)]](https://www.rsc.org/images/entities/char_2009.gif) E0 E0![[thin space (1/6-em)]](https://www.rsc.org/images/entities/char_2009.gif) + +![[thin space (1/6-em)]](https://www.rsc.org/images/entities/char_2009.gif) (k2)1/(n1−n2) (k2)1/(n1−n2) | (37) |
IV. Conversion of energy-dependent data into temperature-dependent data
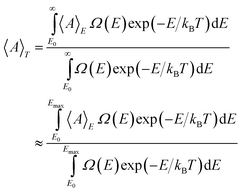
For large systems, the distribution of kinetic energy at constant total energy, as well as in the canonical ensemble, is extremely narrow. The canonical and microcanonical ensembles are then equivalent and the total energy can be immediately translated into temperature. In contrast, in the case of a smaller system as Pd13, the fluctuation in kinetic energy is considerable and a Boltzmann weighting must be employed to convert microcanonical data into canonical data. For such a Boltzmann weighting, the DOS of the cluster must be known. In the microcanonical simulations presented here, no direct determination of the DOS is included but by using the fitted two-state DOS model, the conversion of microcanonical data into canonical data can be carried out.In the microcanonical simulations, quantities are averaged at a constant total energy. Say that A is a quantity that has been sampled for energies up to E![[thin space (1/6-em)]](https://www.rsc.org/images/entities/char_2009.gif) =
=![[thin space (1/6-em)]](https://www.rsc.org/images/entities/char_2009.gif) Emax. The average of A at the temperature T is then given by a Boltzmann weighting including the density of states, i.e.
Emax. The average of A at the temperature T is then given by a Boltzmann weighting including the density of states, i.e.
| |  | (38) |
The approximation of replacing ∞ with
Emax is acceptable if the temperature is so low that the contribution from
E![[thin space (1/6-em)]](https://www.rsc.org/images/entities/char_2009.gif)
>
![[thin space (1/6-em)]](https://www.rsc.org/images/entities/char_2009.gif) Emax
Emax is negligible. We have chosen to define the highest temperature
Tmax for which the conversion is acceptable as the temperature giving
| |  | (39) |
Using data from the microcanonical simulations and the model DOS with the fitted parameters,
Tmax can be calculated and subsequently 〈
A〉
T for
T![[thin space (1/6-em)]](https://www.rsc.org/images/entities/char_2009.gif)
<
![[thin space (1/6-em)]](https://www.rsc.org/images/entities/char_2009.gif) Tmax
Tmax.
V. Results for Pd13, Pd55, Pd147 and Pd309
Let us first have a look at the caloric curve from MC-CAN simulations of Pd13, Pd55 and Pd147. The caloric curve of the total energy is constructed by adding Ekin![[thin space (1/6-em)]](https://www.rsc.org/images/entities/char_2009.gif) =
=![[thin space (1/6-em)]](https://www.rsc.org/images/entities/char_2009.gif) 3NkBT/2 to the sampled potential energy and it is drawn as big symbols in the upper panel of Fig. 1. As expected, the curves exhibit the typical S-bend around the melting point. Simulation results are fitted to eqn. (20) in a least-square sense and the resulting parameters are given in Table 1. The fitted model caloric curves are also shown as solid lines in Fig. 1. The curves are in good agreement with simulation data and we find that the model DOS describes the thermal behavior of the clusters very well. As a measure of the accuracy of the DOS model, the maximal difference between the potential energy from the simulations and from the model DOS,
3NkBT/2 to the sampled potential energy and it is drawn as big symbols in the upper panel of Fig. 1. As expected, the curves exhibit the typical S-bend around the melting point. Simulation results are fitted to eqn. (20) in a least-square sense and the resulting parameters are given in Table 1. The fitted model caloric curves are also shown as solid lines in Fig. 1. The curves are in good agreement with simulation data and we find that the model DOS describes the thermal behavior of the clusters very well. As a measure of the accuracy of the DOS model, the maximal difference between the potential energy from the simulations and from the model DOS,| | QEtot![[thin space (1/6-em)]](https://www.rsc.org/images/entities/char_2009.gif) = =![[thin space (1/6-em)]](https://www.rsc.org/images/entities/char_2009.gif) max|Etot,simulation max|Etot,simulation![[thin space (1/6-em)]](https://www.rsc.org/images/entities/char_2009.gif) − −![[thin space (1/6-em)]](https://www.rsc.org/images/entities/char_2009.gif) Etot,model DOS|, Etot,model DOS|, | (40) |
was calculated and given in Table 1. The melting points in accordance with eqn. (21) are indicated by vertical lines.
Table 1 The model DOS parameters and the melting points after fitting MC-CAN simulation data to eqn. (20). (Exception: Pd34.) As a comparison, the minimum energy per atom obtained by a steepest descent search is listed as Emin. The melting points of the MD-NH simulations22 are obtained using eqn. 41
| N | n1/N | n2/N | k2/eV(n1−n2) | E0/N/eV | (QEtot/N)/eV | Tm/K | Tm,MD-NH/K | Emin/eV |
|---|
| 13 | 3.10 | 4.14 | 2![[thin space (1/6-em)]](https://www.rsc.org/images/entities/char_2009.gif) × ×![[thin space (1/6-em)]](https://www.rsc.org/images/entities/char_2009.gif) 10−9 10−9 | −2.67 | 0.011 | 1110 | 1099 | −2.66 |
| 55 | 3.46 | 4.47 | 7![[thin space (1/6-em)]](https://www.rsc.org/images/entities/char_2009.gif) × ×![[thin space (1/6-em)]](https://www.rsc.org/images/entities/char_2009.gif) 10−69 10−69 | −2.99 | 0.022 | 908 | 1034 | −2.97 |
| 147 | 3.42 | 4.57 | 3![[thin space (1/6-em)]](https://www.rsc.org/images/entities/char_2009.gif) × ×![[thin space (1/6-em)]](https://www.rsc.org/images/entities/char_2009.gif) 10−293 10−293 | −3.12 | 0.016 | 1076 | 1163 | −3.11 |
| 34 | — | — | — | — | | ≈350 | — | −2.85 |
| 54 | 3.24 | 4.33 | 3![[thin space (1/6-em)]](https://www.rsc.org/images/entities/char_2009.gif) × ×![[thin space (1/6-em)]](https://www.rsc.org/images/entities/char_2009.gif) 10−71 10−71 | −2.97 | 0.013 | 893 | — | −2.95 |
The results from ref. 22, where Grönbeck et al. employed molecular dynamics simulation with the Nosé–Hoover thermostat (MD-NH), are drawn as plusses. The data from ref. 22 is slightly modified as compared to Fig. 1 in ref. 22. In that publication, the temperature of the cluster was calculated from Ekin![[thin space (1/6-em)]](https://www.rsc.org/images/entities/char_2009.gif) =
=![[thin space (1/6-em)]](https://www.rsc.org/images/entities/char_2009.gif) 3NkBT/2 despite the fact that the rotation and translation were kept to zero. Here, we use the correct expression
3NkBT/2 despite the fact that the rotation and translation were kept to zero. Here, we use the correct expression
when setting the temperature scale of the MD-NH simulations and by doing so we find good agreement between the MC-CAN and the MD-NH simulations. Precisely at melting, the MC and MD-NH curves do however disagree for the two larger clusters. This is not due to fundamental differences between the methods, but is a result of the simulations in the MD-NH case being too short. The temperatures for which the caloric curves differ are within the coexistence region. There is a free energy barrier between solid and molten structures and if the cluster is large the simulations might need to be unreasonably long to allow for a large number of phase switches and a correct distribution between the phases. As explained in detail below we argue that the barrier does not prevent a correct simulation in the coexistence region in the case of Pd
13 but does so in our simulations of Pd
55 and Pd
147. Since the simulations start with the solid structure, this structure was favored leading to overestimated melting points. Consequently, the longer MC-CAN simulations lead to lower melting points for Pd
55 and Pd
147. The melting points from the MD-NH simulations obtained using
eqn. (41) are listed in
Table 1. For Pd
13 there is good agreement with the MC-CAN simulations. For Pd
55 and Pd
147 the melting points are probably overestimated in both the MC-CAN and MD-NH simulations.
The heat capacity per atom is obtained as the variance of the energy during a simulation (see eqn. (24)). In the lower panel of Fig. 1, Cv per atom from the MC simulations is compared with the heat capacity derived from the model DOS. (Note the logarithmic scale of the heat capacity). The agreement in determination of the melting point is good. The peaks in heat capacity are due to the fluctuations between the solid and molten phases that result in fluctuations in potential energy. The heat capacity from simulation and from the DOS model differ qualitatively at low temperatures. The model DOS implies that the heat capacity should be constant at low temperatures. In the simulations, however, the heat capacity increases with temperature as the vibrations in the cluster become increasingly anharmonic when the temperature is raised.
The caloric curves from the microcanonical simulations MC-MICRO are drawn in Fig. 2. The upper curve in each panel is the potential energy minus the minimal potential energy and the lower curve is the kinetic energy of the clusters. As predicted by the model DOS, the curves show two regions of linear character and an intermediate coexistence region. At the melting, the kinetic energy behaves peculiarly in the sense that it decreases when the total energy increases. This is a well-known phenomenon for finite systems.3,4 The explanation is that in principle only two states are available. At the switch from solid to molten phase, energy must be taken from the kinetic energy and given to the potential energy in order to attain the high-energy molten structure. The kinetic energy data in Fig. 2 are fitted to eqn. (35) giving the parameters in Table 2. The agreement with the parameters from MC-CAN and MC-MICRO is striking and so is the calculated melting temperature, except for Pd147. The caloric curves calculated using eqn. (35) are drawn as solid lines in Fig. 2. The agreement is good showing that the two-state model DOS indeed captures the fundamental behavior of the clusters. In Sec. 5.A, we will return to the discrepancy for the parameters of Pd147 which is due to the barrier between the solid and molten phases and not to the character of the ensembles. As a measure of the accuracy of the DOS model, the maximal difference between the potential energy from the simulations and from the model DOS,
| | QEkin![[thin space (1/6-em)]](https://www.rsc.org/images/entities/char_2009.gif) = =![[thin space (1/6-em)]](https://www.rsc.org/images/entities/char_2009.gif) max|Ekin,simulation max|Ekin,simulation![[thin space (1/6-em)]](https://www.rsc.org/images/entities/char_2009.gif) − −![[thin space (1/6-em)]](https://www.rsc.org/images/entities/char_2009.gif) Ekin,model DOS|, Ekin,model DOS|, | (42) |
has been calculated and is given
Table 2.
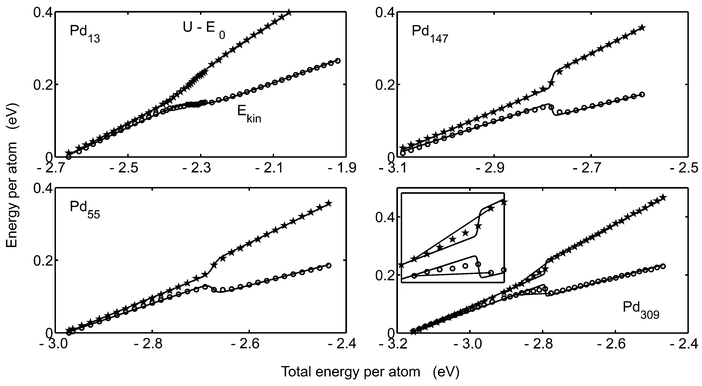 |
| | Fig. 2 The caloric curves of the microcanonical simulations for Pd13, Pd55, Pd147 and Pd309. The rings show the kinetic energy and the pentagrams show the potential energy minus E0versus total energy. The solid lines are the caloric curves resulting from the model DOS according to eqn. (35). In the figure of Pd309, grey lines show the caloric curves assuming that the cluster melts bulk-like. The inset is a magnification of the melting interval of Pd309. | |
Table 2 The model DOS parameters and the melting points after fitting MC-MICRO simulation data to eqn. (35). (Exception: Pd34.) As a comparison, the minimum energy per atom obtained by a steepest descent search is listed as Emin. The melting point TM is calculated as in eqn. (21)
| N | n1/N | n2/N | k2/eV(n1−n2) | (E0/N)/eV | (QEkin/N)/eV | TM/K | (Em/N)/eV | [(Em![[thin space (1/6-em)]](https://www.rsc.org/images/entities/char_2009.gif) − −![[thin space (1/6-em)]](https://www.rsc.org/images/entities/char_2009.gif) E0)/N]/eV E0)/N]/eV | Minimum energy per atom/eV |
|---|
| 13 | 3.14 | 4.14 | 3![[thin space (1/6-em)]](https://www.rsc.org/images/entities/char_2009.gif) × ×![[thin space (1/6-em)]](https://www.rsc.org/images/entities/char_2009.gif) 10−9 10−9 | −2.67 | 0.005 | 1116 | −2.32 | 0.35 | −2.66 |
| 34 | — | — | — | — | — | — | −2.76 | 0.09 | −2.85 |
| 54 | 3.08 | 4.07 | 3![[thin space (1/6-em)]](https://www.rsc.org/images/entities/char_2009.gif) × ×![[thin space (1/6-em)]](https://www.rsc.org/images/entities/char_2009.gif) 10−63 10−63 | −2.96 | 0.007 | 894 | −2.68 | 0.28 | −2.95 |
| 55 | 3.28 | 4.32 | 5![[thin space (1/6-em)]](https://www.rsc.org/images/entities/char_2009.gif) × ×![[thin space (1/6-em)]](https://www.rsc.org/images/entities/char_2009.gif) 10−70 10−70 | −2.98 | 0.006 | 926 | −2.67 | 0.30 | −2.97 |
| 147 | 3.42 | 4.59 | 7![[thin space (1/6-em)]](https://www.rsc.org/images/entities/char_2009.gif) × ×![[thin space (1/6-em)]](https://www.rsc.org/images/entities/char_2009.gif) 10−293 10−293 | −3.12 | 0.015 | 996 | −2.78 | 0.34 | −3.11 |
| 309 | 3.31 | 4.45 | 3![[thin space (1/6-em)]](https://www.rsc.org/images/entities/char_2009.gif) × ×![[thin space (1/6-em)]](https://www.rsc.org/images/entities/char_2009.gif) 10−727 10−727 | −3.17 | 0.020 | 1121 | −2.79 | 0.37 | −3.17 |
The correspondence between the canonical and microcanonical ensembles can be seen in Fig. 3. The potential energy in the MC-CAN simulations are shown as symbols and the converted data from MC-MICRO simulations according to eqn. (38) are shown as solid lines. The agreement is good for Pd13 and Pd55. Again, the discrepancy for Pd147 is due to the phase barrier.
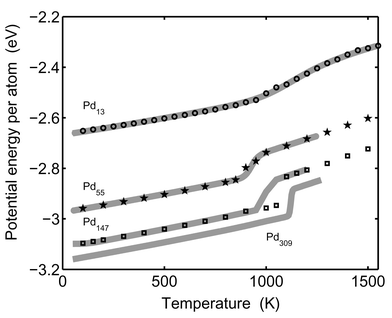 |
| | Fig. 3 The simulated average potential energy is shown as a function of temperature. The solid lines show the converted microcanonical data (eqn. (38)). The lines are from the bottom: Pd309, Pd147, Pd55 and Pd13. Simulation data from the canonical MC-CAN runs are shown as rings (Pd13), pentagrams (Pd55) and squares (Pd147). | |
The geometric shape of a cluster changes upon melting.14 In Fig. 4, the average radii of gyration versus temperature are drawn for Pd13, Pd55, Pd147 and Pd309. The radii of gyration are calculated for each configuration and are then sorted in order to sample the maximal, medium and minimal radius of gyration. In the solid clusters, the radii of gyration are almost identical. In contrast, the radii of gyration for molten clusters are split up with one radius even decreasing compared to the solid phase and the other ones dramatically increasing. The radii of gyration of Pd13 at 1300 K are in ratios 2.5 ∶ 2.3 ∶ 2.0, and if approximating the cluster with a solid ellipsoid, the corresponding semi-axes are 4.4 ∶ 3.5 ∶ 2.8, which is far from a spherical shape. The semi-axes of Pd147 at the same temperature are in ratios 9.5 ∶ 8.3 ∶ 7.5. The transformation from spherically symmetric shapes to non-spherical shapes upon melting contradicts the general knowledge that a liquid droplet favors a spherical shape due to surface tension.48 However, for these tiny clusters, the configuration fluctuations are noticeable, causing a split up of the radii of gyration. We believe that the ratio of the fluctuations to the cluster radius will diminish when the number of atoms increases so that the cluster eventually behaves like a liquid droplet. In Fig. 4, the ratio of the maximal to the minimal radius is indeed smaller for Pd147 than for Pd13. The rings in the Pd55 figure are from the MD-NH simulations in.22 The two methods agree except in the temperature interval 900–1050 K, where the two methods also disagree in energy (Fig. 1). The reason for the disagreement is also the same, i.e., the cluster spends too short a time in the molten phase in the MD-NH simulations which are not sufficiently long.
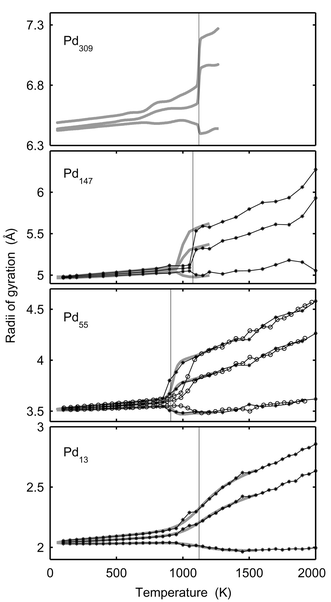 |
| | Fig. 4 The maximal, medium and minimal radii of gyration versusT for Pd13, Pd55, Pd147 and Pd309. The star-lines show canonical MC-CAN results. The thick grey lines are the converted microcanonical MC-MICRO results. The vertical lines indicate the melting points in Table 1
(for Pd309 according to Table 2). The curves with rings for Pd55 are from the MD-NH simulations in ref. 22. | |
In Figs. 5 and 6, δ, the dispersion in atomic separation, and dCM, the mean distance to the centre of mass, are drawn. It is noticeable that the rise in δ for Pd13 starts far below the melting point. The rise in δ starts when surface atoms start to switch positions and this occurs at the very beginning of the melting interval (800 K). The dramatic change in shape does however not occur until at 1000 K. The dramatic change in shape of Pd147 upon melting is depicted in Fig. 7. Two snapshots are shown for 100 K (solid phase) and 1400 K (molten phase), respectively.
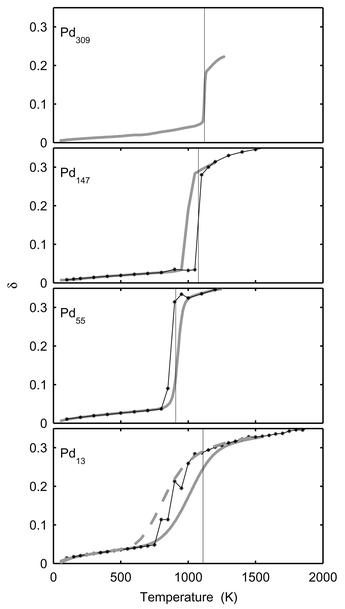 |
| | Fig. 5 The Lindemann index, δ, versusT for Pd13, Pd55, Pd147 and Pd309. The star-lines show canonical MC-CAN results. The thick grey lines are the converted microcanonical MC-MICRO results. The dashed grey line for Pd13 shows δ when calculated from converted microcanonical 〈rij〉 and 〈r2ij〉. The vertical lines indicate the melting points in Table 1
(for Pd309 according to Table 2). | |
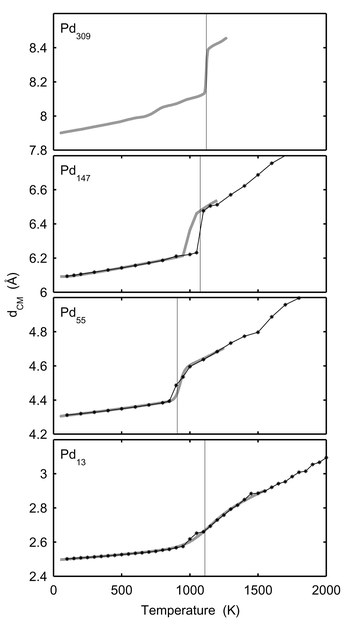 |
| | Fig. 6 The average distance to the centre of mass, dCM, versusT for Pd13, Pd55, Pd147 and Pd309. The star-lines show canonical MC-CAN results. The thick grey lines are the converted microcanonical MC-MICRO results. The vertical lines indicate the melting points in Table 1
(for Pd309 according to Table 2). | |
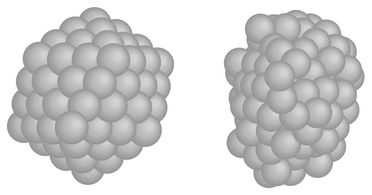 |
| | Fig. 7 Two snapshots of Pd147. The right one is at 100 K (solid phase) and the left one at 1400 K (molten phase). | |
For the radii of gyration, δ and dCM, the agreement between the MC-CAN results and the converted MC-MICRO results is good with two exceptions. As already mentioned, the MC-CAN and MC-MICRO simulations disagree for Pd147 in the melting region due to the phase barrier. The second discrepancy for δ is found for Pd13 and Pd55 near melting. In both cases the rise is at lower temperatures with the canonical data. However, δ has the nature of a standard deviation. In the MC-MICRO simulations, this standard deviation is calculated for subsets of the phase space of the cluster and then averaged into the temperature-dependent values. Such a procedure cannot be expected to give a correct correspondence with the canonical value in the melting region. A better way would be to convert the averages 〈rij〉E and 〈r2ij〉E into temperature-dependent 〈rij〉T and 〈r2ij〉T and thereafter to calculate a temperature-dependent δ. When doing so for Pd13 the dashed curve in Fig. 5 is obtained. The agreement with canonical data is now better but not perfect. A further explanation of the discrepancy between canonical and converted microcanonical results is that although the simulations were sufficiently long to give accurate averages for most quantities, even longer simulations are required to give accurate values of δ. For instance, we see that the canonical δ is not even constantly increasing with temperature as must be expected. Since the phase space of the cluster is finite we believe that if the simulations were infinite, a perfact match between canonical and converted microcanonical δ would result. Also in the results from Gallego et al.24 and Grimson25 we can see that the agreement between canonical and microcanonical data is much better for the potential energy than for δ. We believe that a direct conversion of δ and too short simulations are the reasons for the discrepancy for δ also in their simulations.
An indication that the cluster can be decomposed into two major isomers is the distribution of the potential energy for Pd55 at 900 K as shown in Fig. 8. The potential energy density is split up into two peaks. The solid line is the distribution according to the model DOS (eqn. 19). Simulation results and the model are in fair agreement but the relative heights of the two peaks are very sensitive to temperature. The model is not capable of capturing this temperature behavior exactly. A similar histogram with two peaks is found for Pd55 in the MC-MICRO simulations at a total energy corresponding to the coexistence region.
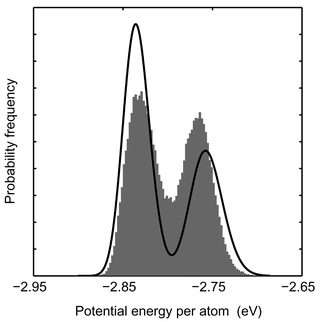 |
| | Fig. 8 Distributions of the potential energy for Pd55 at 900 K according to the canonical MC-CAN simulation. Averages over 1000 steps in the MC simulation are collected in the histogram. The distribution of potential energy for a single configuration according to the model DOS is drawn as a solid line. | |
A. Free energy barrier
In the coexistence region the cluster constantly switches between solid and molten phases. This can be seen for instance by following how the potential energy varies during a simulation. The mean distance to the centre of mass and the potential energy of Pd13 are plotted versus number of macro steps in Fig. 9. The cluster temperature is 1100 K which is in the middle of the coexistence region. (One macro step equals N MC steps where N is the number of atoms in the cluster. The macro step is a better quantity when comparing simulation lengths of clusters of different sizes.)
Fig. 9 clearly shows how the cluster frequently switches phases. The ratio of macro steps in molten phase to solid phase equals the equilibrium constant. However, in the cases of Pd55 and Pd147, only a few switches are found and in the case of Pd147, we have never observed any true switch from molten to solid phase in a MC-CAN simulation (Fig. 10). This problem is due to the free energy barrier between the regions in the phase space. As a consequence of the barrier, it is difficult to determine the equilibrium constant KT as a function of T, and particularly the determination of the melting point is inaccurate. In contrast, the barrier for switches between the phases for Pd13 is low enough that, in the course of a normal simulation, the cluster can switch phases so many times that proper statistics should have been obtained. The problem to obtain correct distribution between phases is the explanation why the MD-NH simulations of Grönbeck22 differ from the MC simulations in the coexistence region. The MD-NH simulations were interrupted too early so that the cluster spent a shorter time in the molten phase than in the MC simulations. The consequence is an estimated higher melting point. In the case of Pd13 the barrier is easily overcome and the MD-NH and MC simulations agree.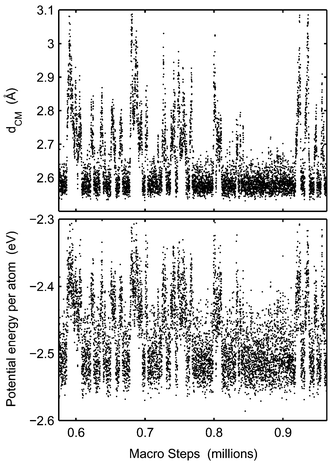 |
| | Fig. 9 The mean distance to the centre of mass (upper panel) and potential energy (lower panel) of Pd13 in the course of a MC-CAN simulation are shown at 1100 K. Each dot is an average over 1000 simulation steps. | |
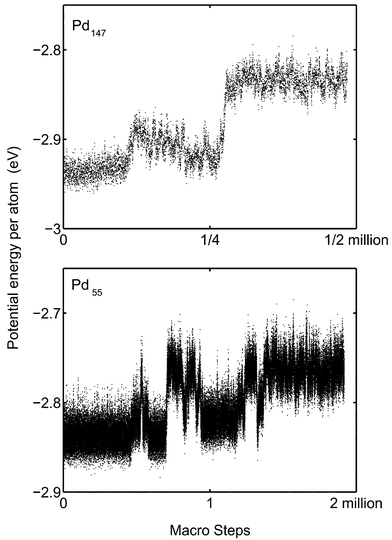 |
| | Fig. 10 Upper panel: The potential energy of Pd147 in the course of a MC-CAN simulation is shown at 1100 K. Each dot is an average over 10![[thin space (1/6-em)]](https://www.rsc.org/images/entities/char_2009.gif) 000 simulation steps. Lower panel: The potential energy of Pd55 in the course of a MC-CAN simulation is shown at 900 K. Each dot is an average over 1000 simulation steps. 000 simulation steps. Lower panel: The potential energy of Pd55 in the course of a MC-CAN simulation is shown at 900 K. Each dot is an average over 1000 simulation steps. | |
For Pd13 and Pd55 the MC-CAN and MC-MICRO simulations are in good agreement in the coexistence region. This is not the case for Pd147. Presumably the reason is the phase barrier. In Fig. 11 the evolution of the potential energy is followed in a MC-MICRO simulation at melting. Comparing the energy scales for Pd147 in Figs. 10 and 11, we see that the phase switch implies a smaller change in potential energy in the microcanonical case than in the canonical case. At fixed total energy, the phase switch occurs between relatively high-energy solid and low-energy molten phases while at fixed temperature both low-energy solid phases as well as high-energy molten phases are attainable. The phase switch to molten phase seemingly occurs at a lower “temperature” in MC-MICRO than in MC-CAN. The reason might be the difference in the potential energy step between the phases. The reason might however also be mere chance which is supported by the fact that the melting point of Pd55 is higher in the MC-MICRO simulations.
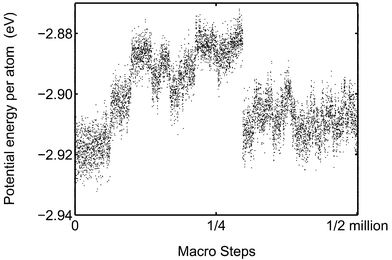 |
| | Fig. 11 The potential energy of Pd147 in the course of a MC-MICRO simulation is shown at the total energy −2.765 eV per atom. Each dot is an average over 10![[thin space (1/6-em)]](https://www.rsc.org/images/entities/char_2009.gif) 000 simulation steps. 000 simulation steps. | |
Let us return to the caloric curve of Pd309 in Fig. 2. The curves show the S-bend at melting which is typical for a two-state system. In bulk, the behavior is different. Since bulk solid can melt gradually so that for instance half the atoms of the bulk are in a molten phase, bulk melting in the microcanonical ensemble is characterized by a horizontal line in a graph of the kinetic energy versus the total energy. Such a line is indicated in Fig. 2 for Pd309. The reason why Pd309 seems to melt like a two-state system might be any of two explanations or both. Obviously, the cluster might be sufficiently small so that it is still well described as a two-state system. However, the apparent two-state behavior might be an artifact due to the phase barrier. Although the simulations of Pd309 lasted for 50 million steps, no fluctuation between phases was ever observed. In all the simulations the starting configuration was a solid one and thus it might be so that the cluster does not manage to overcome the barrier until the total energy is high enough that the entire cluster should be molten. If this is the case and the simulations are sufficiently long so that the coexistence between fractions of solid and molten phases is established, the caloric curves of Pd309 should be like the grey lines in Fig. 2. The conclusion is that our simulations cannot resolve whether the Pd309 is a true two-state system or a bulk-like system. An example of a rather small cluster with a bulk-like melting is Au459 in the simulations of Cleveland et al.15
The obstacle in the form of barrier crossing has been considered by e.g. Beck et al.30 Doye et al.31 observed barriers between solid and molten phases for LJ55, a cluster of 55 Lennard-Jones interacting particles. This problem is even more evident in bulk simulations with periodic boundary constraints. Belonoshko and coworkers found that in simulations of bulk aluminum oxide, the melting point was overestimated by several hundred kelvin due to the barrier between the phases.32 Two-phase simulations32,33 were developed in order to reduce the barrier problem for bulk systems. In such simulations, a cube of solid structure is in contact with a cube of a liquid structure. The interface is a seed for both melting and freezing and hopefully the system will transform into the correct phase for all temperatures. Such a method is however not useful in simulations of small clusters, which should switch phase constantly and not only once. On the other hand, an advantage of small cluster simulations is that the simulations are reliable if frequent phase switches are observed. A corresponding criterion for successful determination of the melting point in bulk simulations is more difficult to define.
What is the character of the phase barrier? We have observed some crossings where the barrier is not a potential energy barrier. When zooming into the potential energy curves in Fig. 10, it is clear that the clusters do not need to overcome a high potential energy barrier. In the solid to molten phase direction, a high step in potential energy must be climbed but in the opposite direction, no potential barrier hinders the transformation. Since the free energy is constituted of a potential energy part and an entropic part, the barrier in the molten to solid direction must be of entropic character only. Zwanzig and Zhou described in a simple model how an exclusively entropic barrier might very well represent the decay behavior of the transformation between different states.49 The dynamics of the melting might be illustrated by the time evolution of the distance from the centre of mass in a simulation. In Fig. 12, the distance to the centre of mass for the 55 atoms in Pd55 is drawn versus number of macro steps. The temperature is 900 K which is close to the melting point. To the left, the cluster is in the solid phase and one particle is in the middle, 12 particles are at about 2.6 Å from the centre of mass, and the rest of the atoms are in the outermost shell. At about 400![[thin space (1/6-em)]](https://www.rsc.org/images/entities/char_2009.gif) 000 macro steps, one atom in the outermost shell moves out of the shell and becomes a so-called “floater”. (The term was originally used by Cheng et al.50) This atom is shown with a thick grey line to distinguish it from the other atoms. This floater causes the first melting but the cluster immediately switches back to the solid phase again. The second melting, at about 600
000 macro steps, one atom in the outermost shell moves out of the shell and becomes a so-called “floater”. (The term was originally used by Cheng et al.50) This atom is shown with a thick grey line to distinguish it from the other atoms. This floater causes the first melting but the cluster immediately switches back to the solid phase again. The second melting, at about 600![[thin space (1/6-em)]](https://www.rsc.org/images/entities/char_2009.gif) 000 macro steps is not preceded by floaters but is very sudden in character. Thus two kinds of melting is observed. In the simulations, the melting with a preceding floater seems to be most common. All the freezing events (at 450
000 macro steps is not preceded by floaters but is very sudden in character. Thus two kinds of melting is observed. In the simulations, the melting with a preceding floater seems to be most common. All the freezing events (at 450![[thin space (1/6-em)]](https://www.rsc.org/images/entities/char_2009.gif) 000, 750
000, 750![[thin space (1/6-em)]](https://www.rsc.org/images/entities/char_2009.gif) 000, 820
000, 820![[thin space (1/6-em)]](https://www.rsc.org/images/entities/char_2009.gif) 000 and 850
000 and 850![[thin space (1/6-em)]](https://www.rsc.org/images/entities/char_2009.gif) 000 macro steps) are very sudden. The melting seems to be triggered by floaters or defects but we have not observed any special event just before freezing.
000 macro steps) are very sudden. The melting seems to be triggered by floaters or defects but we have not observed any special event just before freezing.
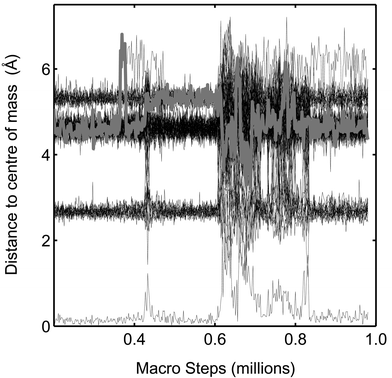 |
| | Fig. 12 The distance to the centre of mass for each of the 55 atoms in Pd55 in the course of a simulation is shown at 900 K. One of the atoms is indicated by a thick grey line. (The figure corresponds to Fig. 10). | |
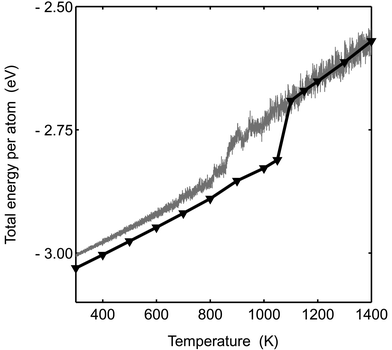
The barrier between the phases will cause hysteresis of the caloric curve. In the simulations presented this far, the initial configurations were always solid and the barrier hinders the solid to molten phase switch resulting in too high an estimated melting point. In contrast to the MC-CAN simulations, we have seen molten to near-solid transformation for Pd147 in MC-ANNEAL simulations. The cluster was annealed from Tinitial![[thin space (1/6-em)]](https://www.rsc.org/images/entities/char_2009.gif) =
=![[thin space (1/6-em)]](https://www.rsc.org/images/entities/char_2009.gif) 1400 K to Tfinal
1400 K to Tfinal![[thin space (1/6-em)]](https://www.rsc.org/images/entities/char_2009.gif) =
=![[thin space (1/6-em)]](https://www.rsc.org/images/entities/char_2009.gif) 300 K during 100 million steps. The two caloric curves exhibiting hysteresis are shown in Fig. 13. As a matter of fact, the molten cluster never reaches the true solid configuration but a glass configuration of a little higher potential energy. The barrier problem seems to increase with cluster size. The barrier between the phases is indeed expected to increase with cluster size.51
300 K during 100 million steps. The two caloric curves exhibiting hysteresis are shown in Fig. 13. As a matter of fact, the molten cluster never reaches the true solid configuration but a glass configuration of a little higher potential energy. The barrier problem seems to increase with cluster size. The barrier between the phases is indeed expected to increase with cluster size.51
 |
| | Fig. 13 Total energy per atom is plotted versusT for Pd147. The solid line with the triangles is the result from the MC-CAN simulation. The grey line is from an MC-ANNEAL simulation where the temperature was reduced by 11![[thin space (1/6-em)]](https://www.rsc.org/images/entities/char_2009.gif) × ×![[thin space (1/6-em)]](https://www.rsc.org/images/entities/char_2009.gif) 10−6 K per step. 10−6 K per step. | |
A crucial question is how to solve the problem with barriers in simulations? In the MC simulation, the maximal distance an atom can move in one step is set so that 50% of all attempts are rejected. Is it possible that it is easier for the cluster to overcome the phase barrier if the atoms move by shorter or longer steps? In order to test this we simulated Pd55 at 900 K with maximal displacements giving 35% and 65% rejection, respectively. The simulations did not indicate that another maximal displacement would enhance the number of phase switches. In the literature, different techniques are proposed to ease the overcoming of barriers. In the j-walking technique used by e.g. Moseler and Nordiek8 and Frantz,12 configurations corresponding to a higher temperature are occasionally incorporated in the simulation. With a modification of this method called q-jumping MC, Calvo et al.13 found that a solid-molten phase barrier was indeed easier to overcome. In a future publication we will address the problem with phase barriers in clusters with another refined simulation method: the reference system equilibration method.52
VI. Results for Pd34 and Pd54
This far we have only considered icosahedral clusters with closed geometric shells. In this work we have also studied what happens to the melting point when one atom and half the outer shell, respectively, are removed from Pd55. We expect the melting points to be lower than for Pd55, since when the outer shell is not closed, the mobility of the atoms is increased. The thermal behavior of the Pd54 cluster is very similar to that of Pd55. The caloric equation was fitted to the model DOS, giving the parameters in Table 1 and Table 2. As expected, the melting point decreases slightly compared to Pd55.In contrast, the thermal behavior for Pd34 is different. In Fig. 14, the energy, Cv, δ and the radii of gyration from MC-CAN simulations are drawn versus the temperature and in Fig. 15 the caloric curves from MC-MICRO simulations are drawn. It is remarkable that there is no peak in the heat capacity and for this small cluster the reason cannot be a high barrier between phases. The heat capacity does however show two regions: one for a solid phase and one for a molten phase. The lack of peak in-between, is interpreted as indication that there is no coexistence between phases with significantly different energies. The difference between the solid and molten phases for Pd34 is very small. That is supported by the lowest panel in Fig. 14, where the energy does not show the typical S-shape. The increasing slope only indicates that the atoms probe more and more anharmonic parts of the potential energy surface. An evolution of the kinetic energy without the S-bend is also found in Fig. 15. Furthermore, in the upper panel of Fig. 14, the radii of gyration do not indicate any qualitative change of shape upon melting. From the plot of δ we can see that the atoms start to switch position at about 350 K (MC-CAN) and E![[thin space (1/6-em)]](https://www.rsc.org/images/entities/char_2009.gif) =
=![[thin space (1/6-em)]](https://www.rsc.org/images/entities/char_2009.gif) −2.76 eV (MC-MICRO, not shown in figure). For Pd34 we regard the onset of atomic mobility as the melting. An equivalent melting phenomenon was reported for Al43 by Sun et al.53
−2.76 eV (MC-MICRO, not shown in figure). For Pd34 we regard the onset of atomic mobility as the melting. An equivalent melting phenomenon was reported for Al43 by Sun et al.53
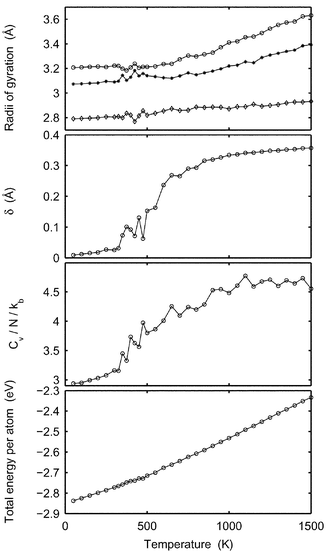 |
| | Fig. 14 Results are shown for Pd34versusT. From above: the maximal, medium and minimal radii of gyration, δ, Cv and the total energy per atom. | |
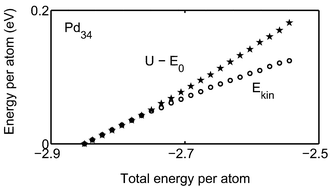 |
| | Fig. 15 The caloric curves of the Mc-MICRO simulations are shown for Pd34. The rings show the kinetic energy and the pentagrams show the potential energy minus E0versus total energy. | |
VII. Conclusions
We have performed Monte Carlo simulations of equilibrating palladium clusters in the canonical ensemble and microcanonical ensembles. In order to avoid the natural fragmentation of a single cluster in an infinite volume at fixed temperature, we have used a new definition of a non-fragmented cluster; the cluster has not fragmented if all atoms are connected via chains of adjacent atoms. Although fragmentation in principle must be prevented for all temperatures, no palladium cluster actually fragmented in reasonable time below 1500 K. The clusters stayed intact sufficiently long to study their equilibrium properties.By use of a two-state model for the density of states, the simulation results from the microcanonical simulations were converted into temperature-dependent data also for the smallest clusters. The agreement between canonical and microcanonical simulations as well as molecular dynamics simulations with Nosé-Hoover thermostat by Grönbeck et al.22 proved to be excellent with a few exceptions in the coexistence region. In the melting region, the accuracy of δ seems to be worse than for other quantities. Therefore we recommend quantities as the potential energy to be used instead of δ for the calculation of the melting point.
Disregarding that properties of clusters may change dramatically when adding one atom, a rule of thumb quoted by many authors is that the melting point increases with size and finally approaches the bulk melting point.28 In our simulations, Pd13 is an exception from this rule, having the highest melting point of the clusters in this study. However, in support of our findings we note that Kusche in recent experiments found that Na57 has a higher melting point than all the cluster sizes they studied in the size interval from 60 to 200 atoms.18
The problems associated with free energy barriers between the solid and molten phases that has previously been reported30,31 were observed in the simulations of Pd54, Pd55, Pd147 and Pd309. The phase barrier hinders correct calculation of the equilibrium constant in the coexistence region and thus the melting point has not been accurately determined for these clusters. With annealing simulations we can however find a lower limit to the melting point, but as in the case of Pd147, with a reasonable cooling rate the width of the hysteresis is too large to give a useful estimation.
If a simulation can be run so that frequent phase switches occur, the phase barrier does not hinder ergodicity and the behavior within the coexistence region is reliable. In the case of Pd309, no such fluctuation was ever observed and the melting of this cluster may not be even qualitatively described. The cluster may behave like the smaller clusters without mixing of the two phases as the simulations at a first glance suggest. However, the cluster may also be so large that in the microcanonical ensemble it should, in principle, melt gradually with increasing total energy but in order to overcome the barrier, the total energy must be so high that the equilibrium state is the totally molten cluster. Half-molten configurations may thus be artificially hidden by the barrier. We have studied the crossing of the phase barrier of Pd55 in more detail. At melting a step upwards in potential energy must be taken, while at freezing the barrier is of entropic character only.
In order to get results that could successfully be compared with experimental values the interaction between the atoms must be more accurately modeled. However, of the same significance is to solve the problem with phase barriers. Methods to more efficiently overcome barriers in simulations have been developed and used, for instance the j-walking8 and the q-jumping variations of the MC method.13 These methods are useful and if they satisfy the criterion that phase fluctuations are observed, the results are reliable. Methods aiming to determine the melting point by computing the DOS of the isolated isomers have been developed.4,3,10 Although the estimated number of molten subisomers is enormous (e.g., 1021 for LJ5554), these methods are promising. In a future publication, we will return to one of the methods available to directly calculate the DOS.
Finally we note that the melting of Pd34 is of different character than that of the other clusters. No distinction is observed between the solid and molten structures and we consider melting to occur when the atoms become mobile in the cluster. The onset of mobility is in this case at a considerably lower temperature than for the other clusters.
Appendix: Definition of a fragmented cluster
We have used the following definition of a non-fragmented cluster: A configuration of atoms form a cluster if all atoms are linked to all other atoms via a chain of adjacent atoms. Two atoms which are closer to each other than an element-specific limit B are said to be adjacent.Let us define the matrix A so that
| |  | (43) |
where
rij is the distance between atoms
i and
j. Then calculate the matrix
M![[thin space (1/6-em)]](https://www.rsc.org/images/entities/char_2009.gif)
=
![[thin space (1/6-em)]](https://www.rsc.org/images/entities/char_2009.gif) AN−1
AN−1, where the matrix multiplication is either standard or Boolean. The following definition of a cluster is then equivalent to the one above:
If all entries in M are non-zero, the configuration is a cluster, but if any element is zero it is not. The proof is omitted but the result follows physically from the fact that a matrix element in
M can only be zero if there is no way to walk between the corresponding atoms in less than
N steps between neighboring atoms. The matrix calculation is simple but somewhat time-consuming. In the simulations however, we have the extra information that before the move of one atom, the atoms did form a cluster. With this knowledge, the determination of fragmentation can be done more efficiently.
In order to estimate a reasonable value of B, the probability distribution of configurations for Pd2 and Pd3 were used. These probability distributions show minima when the interatomic distances are 4–5 Å. The configurations of Pd2 and Pd3 with interatomic distances less than 4 Å would therefore be of non-fragmented character and when any distance is greater than 5 Å, atoms have evaporated. With this indication of a reasonable B, simulations of Pd13 were performed for various B between 4.0 Å and 5.8 Å. The simulations for different B gave almost identical results and all the simulations can safely be considered to represent “non-fragmented” clusters. The results in Secs. 5 and 6 are all for B![[thin space (1/6-em)]](https://www.rsc.org/images/entities/char_2009.gif) =
=![[thin space (1/6-em)]](https://www.rsc.org/images/entities/char_2009.gif) 4.0 Å.
4.0 Å.
Acknowledgements
We are grateful for assistance from Anatoly Belonoshko (Uppsala University) and Henrik Grönbeck (Göteborg University). The project was financially supported by The Swedish Foundation for Strategic Research, SSF and The Swedish Research Council, NFR.References
- R. S. Berry, T. L. Beck, H. L. Davis and J. Jellinek, Adv. Chem. Phys., 1988, 52, 75 Search PubMed.
- H.-P. Cheng, X. Li, R. L. Whetten and R. S. Berry, Phys. Rev. A, 1992, 46, 791 CrossRef CAS.
- P. Labastie and R. L. Whetten, Phys. Rev. Lett., 1990, 65, 1567 CrossRef CAS.
- D. J. Wales, Mol. Phys., 1993, 78, 151 CAS.
- T. L. Beck, J. Jellinek and D. J. Wales, J. Chem. Phys., 1987, 87, 545 CrossRef CAS.
- M. Bixon and J. Jortner, J. Chem. Phys., 1989, 91, 1631 CrossRef CAS.
- R. E. Kunz and R. S. Berry, Phys. Rev. Lett., 1993, 71, 3987 CrossRef CAS.
- M. Moseler and J. Nordiek, Phys. Rev. B, 1999, 60, 11
![[thin space (1/6-em)]](https://www.rsc.org/images/entities/char_2009.gif) 734 CrossRef CAS.
734 CrossRef CAS. - J. P. Neirotti, F. Calvo, D. L. Freeman and J. D. Doll, J. Chem. Phys., 2000, 112, 10
![[thin space (1/6-em)]](https://www.rsc.org/images/entities/char_2009.gif) 340 CAS.
340 CAS. - L. M. Amon and W. P. Reinhardt, J. Chem. Phys., 2000, 113, 3573 CrossRef CAS.
- A. Rytkönen, S. Valkealahti and M. Manninen, J. Chem. Phys., 1998, 108, 5826 CrossRef CAS.
- D. D. Frantz, J. Chem. Phys., 1995, 102, 3747 CrossRef CAS.
- F. Calvo and F. Spiegelmann, J. Chem. Phys., 1999, 112, 2888 CrossRef.
- J. Jellinek, T. L. Beck and R. S. Berry, J. Chem. Phys., 1986, 84, 2783 CrossRef CAS.
- C. L. Cleveland, W. D. Luedtke and U. Landmann, Phys. Rev. Lett., 1998, 81, 2036 CrossRef CAS.
- M. Schmidt, R. Kusche, W. Kronmüller, B. von Issendorff and H. Haberland, Phys. Rev. Lett., 1997, 79, 99 CrossRef CAS.
- M. Schmidt, R. Kusche, B. von Issendorff and H. Haberland, Nature, 1998, 393, 238 CrossRef CAS.
- R. Kusche, Th. Hippler, M. Schmidt, B. von Issendorff and H. Haberland, Eur. Phys. J. D, 1999, 9, 1 CrossRef CAS.
- J. Westergren, H. Grönbeck, S. G. Kim and D. Tománek, J. Chem. Phys., 1997, 107, 3071 CrossRef CAS.
- J. Westergren, H. Grönbeck, A. Rosén and S. Nordholm, J. Chem. Phys., 1998, 109, 9848 CrossRef CAS.
- J. Westergren, H. Grönbeck, A. Rosén and S. Nordholm, Nanostruct. Mater., 1999, 12, 281 CrossRef.
- H. Grönbeck, D. Tománek, S. G. Kim and A. Rosén, Chem. Phys. Lett., 1997, 264, 39 CrossRef.
- X. Chen, J. Zhao, Q. Sun, F. Liu, G. Wang and X. Shen, Phys. Status Solidi B, 1996, 193, 355 CAS.
- L. J. Gallego, M. J. Grimson and C. Rey, Phys. Rev. B, 1995, 51, 5518 CrossRef CAS.
- M. J. Grimson, Chem. Phys. Lett., 1992, 195, 92 CrossRef CAS.
- J. Akola and M. Manninen, Phys. Rev. B, 2001, 63, 193
![[thin space (1/6-em)]](https://www.rsc.org/images/entities/char_2009.gif) 410 CrossRef CAS.
410 CrossRef CAS. - F. Ercolessi, W. Andreoni and E. Tosatti, Phys. Rev. Lett., 1991, 66, 911 CrossRef CAS.
- A. Rytkönen, S. Valkealahti and M. Manninen, J. Chem. Phys., 1997, 106, 1888 CrossRef CAS.
- S. Nosé, J. Chem. Phys., 1984, 81, 511 CrossRef CAS; W. G. Hoover, Phys. Rev. A, 1985, 31, 1695 CrossRef.
- T. L. Beck and R. S. Berry, J. Chem. Phys., 1988, 88, 3910 CrossRef CAS.
- J. P. K. Doye and D. J. Wales, J. Chem. Phys., 1995, 102, 9673 CrossRef CAS.
- A. B. Belonoshko, Geochim. Cosmochim. Acta, 1994, 58, 4039 CrossRef CAS; A. B. Belonoshko and L. S. Dubrovinsky, Am. Mineral, 1996, 81, 303 Search PubMed; R. Ahuja, A. B. Belonoshko and B. Johansson, Phys. Rev. E, 1998, 57, 1673 CrossRef CAS; A. B. Belonoshko, Phys. Chem. Minerals, 1998, 25, 138 Search PubMed.
- J. D. Kubicki and A. C. Lasaga, Am. J. Sci., 1992, 292, 153 Search PubMed.
- M. Andersson, J. L. Persson and A. Rosén, J. Phys. Chem., 1996, 100, 12
![[thin space (1/6-em)]](https://www.rsc.org/images/entities/char_2009.gif) 222 CrossRef CAS.
222 CrossRef CAS. - H. Haberland, Clusters of Atoms and Molecules I, Chemical Physics, Springer-Verlag, Berlin, 1995, 52 Search PubMed.
- G. Scoles, Atomic and Molecular Beam Methods, Oxford University Press, Oxford, 1992, vol. 2, p. 231 Search PubMed.
- N. Metropolis, A. W. Rosenbluth, M. N. Rosenbluth, A. H. Teller and E. Teller, J. Chem. Phys., 1953, 21, 1087 CrossRef CAS.
- J. K. Lee, J. A. Barker and F. F. Abraham, J. Chem. Phys., 1973, 58, 3166 CrossRef CAS.
- S. M. Thompson, K. E. Gubbins, J. P. R. B. Walton, R. A. R. Chantry and J. S. Rowlinson, J. Chem. Phys., 1984, 81, 530 CrossRef CAS.
- L. Råde and B. Westergren, Beta-Mathematics Handbook, Studentlitteratur, Lund, 3rd edn., 1995 Search PubMed.
- E. S. Severin, B. C. Freasier, N. D. Hamer, D. L. Jolly and S. Nordholm, Chem. Phys. Lett., 1978, 57, 117 CrossRef CAS.
- H. W. Schranz, S. Nordholm and G. Nyman, J. Chem. Phys., 1990, 94, 1487 CrossRef CAS.
- D. Tománek, S. Mukherjee and K. H. Bennemann, Phys. Rev. B, 1983, 28, 665 CrossRef CAS; W. Zhong, Y. S. Li and D. Tománek, Phys. Rev. B, 1991, 44, 13
![[thin space (1/6-em)]](https://www.rsc.org/images/entities/char_2009.gif) 053 CAS.
053 CAS. - G. L. Estiù and M. C. Zerner, J. Phys. Chem., 1994, 98, 4793 CrossRef CAS.
- C. Rey, L. J. Gallego, J. García-Rodeja, J. A. Alonso and M. P. Iñiguez, Phys. Rev. B, 1993, 48, 8253 CrossRef CAS.
- D. Frenkel and B. Smit, Understanding Molecular Simulation, Academic Press, New York, 1996 Search PubMed.
- F. Calvo and P. Labastie, Chem. Phys. Lett., 1995, 247, 395 CrossRef CAS.
- D. J. Shaw, Introduction to Colloid and Surface Chemistry, Butterworth-Heinemann, Oxford, 1992, p. 64 Search PubMed.
- H.-X. Zhou and R. Zwanzig, J. Chem. Phys., 1991, 94, 6147 CrossRef CAS; R. Zwanzig, J. Chem. Phys., 1992, 97, 3587 CrossRef CAS.
- H.-P. Cheng and R. S. Berry, Phys. Rev. A, 1992, 45, 7969 CrossRef CAS.
- R. M. Lynden-Bell and D. J. Wales, J. Chem. Phys., 1994, 101, 1460 CrossRef CAS.
- L. Ming, S. Nordholm and H. Schranz, Chem. Phys. Lett., 1996, 248, 228 CrossRef CAS.
- D. Y. Sun and X. G. Gong, Phys. Rev. B, 1998, 57, 4730 CrossRef CAS.
- J. P. K. Doye and D. J. Wales, J. Chem.
Phys., 1995, 102, 9659 CrossRef CAS.
Footnote |
| † Present address: AstraZeneca R&D Mölndal, SE-431 83, Mölndal, Sweden. |
|
| This journal is © the Owner Societies 2003 |
Click here to see how this site uses Cookies. View our privacy policy here. ![[thin space (1/6-em)]](https://www.rsc.org/images/entities/char_2009.gif) =
=![[thin space (1/6-em)]](https://www.rsc.org/images/entities/char_2009.gif) (x1,y1,z1,x2,…,zN), represent the distribution for the whole canonical ensemble. The distribution is given by the Boltzmann factor,
(x1,y1,z1,x2,…,zN), represent the distribution for the whole canonical ensemble. The distribution is given by the Boltzmann factor,![[thin space (1/6-em)]](https://www.rsc.org/images/entities/char_2009.gif) ∝
∝![[thin space (1/6-em)]](https://www.rsc.org/images/entities/char_2009.gif) exp(−U(R)/kBT),
exp(−U(R)/kBT),![[thin space (1/6-em)]](https://www.rsc.org/images/entities/char_2009.gif) =
=![[thin space (1/6-em)]](https://www.rsc.org/images/entities/char_2009.gif) 3NkBT/2.
3NkBT/2.![[thin space (1/6-em)]](https://www.rsc.org/images/entities/char_2009.gif) >
>![[thin space (1/6-em)]](https://www.rsc.org/images/entities/char_2009.gif) 0 (cf.refs. 11 and 28). The reason is that although the Boltzmann factor might be considerably larger for the minimum energy configuration than for fragmented configurations, the volume of the phase space corresponding to fragmented configurations is infinite. In order to avoid the inevitable fragmentation, the standard Metropolis Monte Carlo method37 therefore has to be modified so that a move of an atom that leads to fragmentation is rejected. Hence, we define the average value of, for instance, the potential energy at the temperature T as
0 (cf.refs. 11 and 28). The reason is that although the Boltzmann factor might be considerably larger for the minimum energy configuration than for fragmented configurations, the volume of the phase space corresponding to fragmented configurations is infinite. In order to avoid the inevitable fragmentation, the standard Metropolis Monte Carlo method37 therefore has to be modified so that a move of an atom that leads to fragmentation is rejected. Hence, we define the average value of, for instance, the potential energy at the temperature T as 
![[thin space (1/6-em)]](https://www.rsc.org/images/entities/char_2009.gif) =
=![[thin space (1/6-em)]](https://www.rsc.org/images/entities/char_2009.gif) (px1,py1,pz1,px2,…,pzN). However, no quantities related to the momenta, except the kinetic energy, are of interest in this study. Since the potential energy is sampled and the total energy is fixed, the average kinetic energy is automatically obtained and there is no need for simulating the momenta. At a total energy E, the probability of a spatial configuration R, regardless of momenta, must be proportional to the number of available momentum configurations P, on the condition that the kinetic energy satisfies EK
(px1,py1,pz1,px2,…,pzN). However, no quantities related to the momenta, except the kinetic energy, are of interest in this study. Since the potential energy is sampled and the total energy is fixed, the average kinetic energy is automatically obtained and there is no need for simulating the momenta. At a total energy E, the probability of a spatial configuration R, regardless of momenta, must be proportional to the number of available momentum configurations P, on the condition that the kinetic energy satisfies EK![[thin space (1/6-em)]](https://www.rsc.org/images/entities/char_2009.gif) =
=![[thin space (1/6-em)]](https://www.rsc.org/images/entities/char_2009.gif) E
E![[thin space (1/6-em)]](https://www.rsc.org/images/entities/char_2009.gif) −
−![[thin space (1/6-em)]](https://www.rsc.org/images/entities/char_2009.gif) U. The number of momentum configurations is proportional to the density of momentum states,
U. The number of momentum configurations is proportional to the density of momentum states, ![[thin space (1/6-em)]](https://www.rsc.org/images/entities/char_2009.gif) =
=![[thin space (1/6-em)]](https://www.rsc.org/images/entities/char_2009.gif) constant
constant![[thin space (1/6-em)]](https://www.rsc.org/images/entities/char_2009.gif) ×
×![[thin space (1/6-em)]](https://www.rsc.org/images/entities/char_2009.gif) E3N/2−1K.
E3N/2−1K.![[thin space (1/6-em)]](https://www.rsc.org/images/entities/char_2009.gif) ∝
∝![[thin space (1/6-em)]](https://www.rsc.org/images/entities/char_2009.gif) (E
(E![[thin space (1/6-em)]](https://www.rsc.org/images/entities/char_2009.gif) −
−![[thin space (1/6-em)]](https://www.rsc.org/images/entities/char_2009.gif) U(R))3N/2−1.
U(R))3N/2−1.


![[thin space (1/6-em)]](https://www.rsc.org/images/entities/char_2009.gif) =
=![[thin space (1/6-em)]](https://www.rsc.org/images/entities/char_2009.gif) 1.2630 eV, ε0
1.2630 eV, ε0![[thin space (1/6-em)]](https://www.rsc.org/images/entities/char_2009.gif) =
=![[thin space (1/6-em)]](https://www.rsc.org/images/entities/char_2009.gif) 0.08376 eV, r0
0.08376 eV, r0![[thin space (1/6-em)]](https://www.rsc.org/images/entities/char_2009.gif) =
=![[thin space (1/6-em)]](https://www.rsc.org/images/entities/char_2009.gif) 2.758 Å, p
2.758 Å, p![[thin space (1/6-em)]](https://www.rsc.org/images/entities/char_2009.gif) =
=![[thin space (1/6-em)]](https://www.rsc.org/images/entities/char_2009.gif) 14.8 and q
14.8 and q![[thin space (1/6-em)]](https://www.rsc.org/images/entities/char_2009.gif) =
=![[thin space (1/6-em)]](https://www.rsc.org/images/entities/char_2009.gif) 3.40. These parameter values were also used in the work by Grönbeck et al.22 with which we compare our results. This potential compares favorably with SCF-CI calculations of the optimized geometry44 for finite systems like Pd13. The mean radius of the icosahedral structure of Pd13 is with SCF-CI 2.60 Å and with the many-body alloy potential 2.50 Å. Moreover, the energy difference between the icosahedral and octahedral isomers is 0.12 eV with both techniques.
3.40. These parameter values were also used in the work by Grönbeck et al.22 with which we compare our results. This potential compares favorably with SCF-CI calculations of the optimized geometry44 for finite systems like Pd13. The mean radius of the icosahedral structure of Pd13 is with SCF-CI 2.60 Å and with the many-body alloy potential 2.50 Å. Moreover, the energy difference between the icosahedral and octahedral isomers is 0.12 eV with both techniques.


![[thin space (1/6-em)]](https://www.rsc.org/images/entities/char_2009.gif) =
=![[thin space (1/6-em)]](https://www.rsc.org/images/entities/char_2009.gif) (Tfinal
(Tfinal![[thin space (1/6-em)]](https://www.rsc.org/images/entities/char_2009.gif) −
−![[thin space (1/6-em)]](https://www.rsc.org/images/entities/char_2009.gif) Tinitial)/Ns, where Ns is the number of steps during the sampling. Moreover, the maximal displacement is decreased nine times during the sampling period in order to avoid a too high rejection rate when the temperature is lowered. If ΔT is large, the cluster will transform from a molten phase to a glass-like phase. If ΔT is small enough the cluster might attain the highly symmetric solid structure. The phase switch is however obstructed or even prevented by a free energy barrier.
Tinitial)/Ns, where Ns is the number of steps during the sampling. Moreover, the maximal displacement is decreased nine times during the sampling period in order to avoid a too high rejection rate when the temperature is lowered. If ΔT is large, the cluster will transform from a molten phase to a glass-like phase. If ΔT is small enough the cluster might attain the highly symmetric solid structure. The phase switch is however obstructed or even prevented by a free energy barrier.![[thin space (1/6-em)]](https://www.rsc.org/images/entities/char_2009.gif) ⇌
⇌![[thin space (1/6-em)]](https://www.rsc.org/images/entities/char_2009.gif) PdN(m),
PdN(m),
![[thin space (1/6-em)]](https://www.rsc.org/images/entities/char_2009.gif) =
=![[thin space (1/6-em)]](https://www.rsc.org/images/entities/char_2009.gif) Um
Um![[thin space (1/6-em)]](https://www.rsc.org/images/entities/char_2009.gif) −
−![[thin space (1/6-em)]](https://www.rsc.org/images/entities/char_2009.gif) TSm is the Helmholtz free energy of one molten cluster. The partition functions are for single clusters and their form in classical mechanics is
TSm is the Helmholtz free energy of one molten cluster. The partition functions are for single clusters and their form in classical mechanics is

![[thin space (1/6-em)]](https://www.rsc.org/images/entities/char_2009.gif) =
=![[thin space (1/6-em)]](https://www.rsc.org/images/entities/char_2009.gif) 1. When the number of atoms increases, the DOS becomes enormous and KT switches from 0 to ∞ in an infinitesimal temperature interval, in accord with thermodynamics.
1. When the number of atoms increases, the DOS becomes enormous and KT switches from 0 to ∞ in an infinitesimal temperature interval, in accord with thermodynamics.
![[thin space (1/6-em)]](https://www.rsc.org/images/entities/char_2009.gif) =
=![[thin space (1/6-em)]](https://www.rsc.org/images/entities/char_2009.gif) Ωs(E)
Ωs(E)![[thin space (1/6-em)]](https://www.rsc.org/images/entities/char_2009.gif) +
+![[thin space (1/6-em)]](https://www.rsc.org/images/entities/char_2009.gif) Ωm(E)
Ωm(E)![[thin space (1/6-em)]](https://www.rsc.org/images/entities/char_2009.gif) ∝
∝![[thin space (1/6-em)]](https://www.rsc.org/images/entities/char_2009.gif) (E
(E![[thin space (1/6-em)]](https://www.rsc.org/images/entities/char_2009.gif) −
−![[thin space (1/6-em)]](https://www.rsc.org/images/entities/char_2009.gif) E0)n1
E0)n1![[thin space (1/6-em)]](https://www.rsc.org/images/entities/char_2009.gif) +
+![[thin space (1/6-em)]](https://www.rsc.org/images/entities/char_2009.gif) k2(E
k2(E![[thin space (1/6-em)]](https://www.rsc.org/images/entities/char_2009.gif) −
−![[thin space (1/6-em)]](https://www.rsc.org/images/entities/char_2009.gif) E0)n2,
E0)n2,![[thin space (1/6-em)]](https://www.rsc.org/images/entities/char_2009.gif) −
−![[thin space (1/6-em)]](https://www.rsc.org/images/entities/char_2009.gif) E0)n, but to account for the anharmonicity of the vibrations, the exponents n1 and n2 are adjustable parameters. Although E0 may be calculated by a search for the ground state configuration of a cluster, it is regarded an adjustable parameter as well. The prefactor k2 is the last parameter (the prefactor of the solid phase term is arbitrarily set to unity).
E0)n, but to account for the anharmonicity of the vibrations, the exponents n1 and n2 are adjustable parameters. Although E0 may be calculated by a search for the ground state configuration of a cluster, it is regarded an adjustable parameter as well. The prefactor k2 is the last parameter (the prefactor of the solid phase term is arbitrarily set to unity).
![[thin space (1/6-em)]](https://www.rsc.org/images/entities/char_2009.gif) −
−![[thin space (1/6-em)]](https://www.rsc.org/images/entities/char_2009.gif) E0
E0![[thin space (1/6-em)]](https://www.rsc.org/images/entities/char_2009.gif) ∼
∼![[thin space (1/6-em)]](https://www.rsc.org/images/entities/char_2009.gif) (n1
(n1![[thin space (1/6-em)]](https://www.rsc.org/images/entities/char_2009.gif) +
+![[thin space (1/6-em)]](https://www.rsc.org/images/entities/char_2009.gif) 1)kBT, and for high temperatures, 〈E〉T
1)kBT, and for high temperatures, 〈E〉T![[thin space (1/6-em)]](https://www.rsc.org/images/entities/char_2009.gif) −
−![[thin space (1/6-em)]](https://www.rsc.org/images/entities/char_2009.gif) E0
E0![[thin space (1/6-em)]](https://www.rsc.org/images/entities/char_2009.gif) ∼
∼![[thin space (1/6-em)]](https://www.rsc.org/images/entities/char_2009.gif) (n2
(n2![[thin space (1/6-em)]](https://www.rsc.org/images/entities/char_2009.gif) +
+![[thin space (1/6-em)]](https://www.rsc.org/images/entities/char_2009.gif) 1)kBT. In-between, the caloric curve of the model DOS exhibits the typical S-shape of melting as seen in the upper panel in Fig. 1. At low temperatures the vibrations in the cluster are harmonic and 〈E〉T
1)kBT. In-between, the caloric curve of the model DOS exhibits the typical S-shape of melting as seen in the upper panel in Fig. 1. At low temperatures the vibrations in the cluster are harmonic and 〈E〉T![[thin space (1/6-em)]](https://www.rsc.org/images/entities/char_2009.gif) −
−![[thin space (1/6-em)]](https://www.rsc.org/images/entities/char_2009.gif) E0
E0![[thin space (1/6-em)]](https://www.rsc.org/images/entities/char_2009.gif) ∼
∼![[thin space (1/6-em)]](https://www.rsc.org/images/entities/char_2009.gif) (3N
(3N![[thin space (1/6-em)]](https://www.rsc.org/images/entities/char_2009.gif) −
−![[thin space (1/6-em)]](https://www.rsc.org/images/entities/char_2009.gif) 3)kBT. However, with increasing T, the atoms start to probe the anharmonicity of the potential and n1
3)kBT. However, with increasing T, the atoms start to probe the anharmonicity of the potential and n1![[thin space (1/6-em)]](https://www.rsc.org/images/entities/char_2009.gif) +
+![[thin space (1/6-em)]](https://www.rsc.org/images/entities/char_2009.gif) 1 will generally be greater than 3N
1 will generally be greater than 3N![[thin space (1/6-em)]](https://www.rsc.org/images/entities/char_2009.gif) −
−![[thin space (1/6-em)]](https://www.rsc.org/images/entities/char_2009.gif) 3. This is even more true for the molten phase and n2/n1 is about 1.3 for Pd13, Pd54, Pd55, Pd147 and Pd309. The fitting parameters in the model DOS are obtained by a least-squares fit of simulation data to the expression in eqn. (20).
3. This is even more true for the molten phase and n2/n1 is about 1.3 for Pd13, Pd54, Pd55, Pd147 and Pd309. The fitting parameters in the model DOS are obtained by a least-squares fit of simulation data to the expression in eqn. (20).
![[thin space (1/6-em)]](https://www.rsc.org/images/entities/char_2009.gif) =
=![[thin space (1/6-em)]](https://www.rsc.org/images/entities/char_2009.gif) 1 is
1 is 


![[thin space (1/6-em)]](https://www.rsc.org/images/entities/char_2009.gif) −
−![[thin space (1/6-em)]](https://www.rsc.org/images/entities/char_2009.gif) E0 is the available energy that should be distributed among kinetic and potential energies. f(EK|E) may be expressed as an integral over the total coordinate phase space and the total momentum phase space:
E0 is the available energy that should be distributed among kinetic and potential energies. f(EK|E) may be expressed as an integral over the total coordinate phase space and the total momentum phase space:


![[thin space (1/6-em)]](https://www.rsc.org/images/entities/char_2009.gif) =
=![[thin space (1/6-em)]](https://www.rsc.org/images/entities/char_2009.gif) h. With these definitions, the distribution function in eqn. (26) can be written as
h. With these definitions, the distribution function in eqn. (26) can be written as

![[script L]](https://www.rsc.org/images/entities/char_e144.gif) [Ωkin(EK)]
[Ωkin(EK)]![[script L]](https://www.rsc.org/images/entities/char_e144.gif) [Ωpot(U)]
[Ωpot(U)]![[thin space (1/6-em)]](https://www.rsc.org/images/entities/char_2009.gif) =
=![[thin space (1/6-em)]](https://www.rsc.org/images/entities/char_2009.gif)
![[script L]](https://www.rsc.org/images/entities/char_e144.gif) [Ω(E)]
[Ω(E)]![[thin space (1/6-em)]](https://www.rsc.org/images/entities/char_2009.gif) ∝
∝![[thin space (1/6-em)]](https://www.rsc.org/images/entities/char_2009.gif) Ek3N/2−1
Ek3N/2−1


![[thin space (1/6-em)]](https://www.rsc.org/images/entities/char_2009.gif) =
=![[thin space (1/6-em)]](https://www.rsc.org/images/entities/char_2009.gif) 1
1![[thin space (1/6-em)]](https://www.rsc.org/images/entities/char_2009.gif) ⇔
⇔![[thin space (1/6-em)]](https://www.rsc.org/images/entities/char_2009.gif) Ωm(EM)
Ωm(EM)![[thin space (1/6-em)]](https://www.rsc.org/images/entities/char_2009.gif) =
=![[thin space (1/6-em)]](https://www.rsc.org/images/entities/char_2009.gif) Ωs(EM)
Ωs(EM)![[thin space (1/6-em)]](https://www.rsc.org/images/entities/char_2009.gif) ⇔
⇔![[thin space (1/6-em)]](https://www.rsc.org/images/entities/char_2009.gif) (EM
(EM![[thin space (1/6-em)]](https://www.rsc.org/images/entities/char_2009.gif) −
−![[thin space (1/6-em)]](https://www.rsc.org/images/entities/char_2009.gif) E0)n1
E0)n1![[thin space (1/6-em)]](https://www.rsc.org/images/entities/char_2009.gif) =
=![[thin space (1/6-em)]](https://www.rsc.org/images/entities/char_2009.gif) k2(EM
k2(EM![[thin space (1/6-em)]](https://www.rsc.org/images/entities/char_2009.gif) −
−![[thin space (1/6-em)]](https://www.rsc.org/images/entities/char_2009.gif) E0)n2
E0)n2![[thin space (1/6-em)]](https://www.rsc.org/images/entities/char_2009.gif) ⇔
⇔![[thin space (1/6-em)]](https://www.rsc.org/images/entities/char_2009.gif) EM
EM![[thin space (1/6-em)]](https://www.rsc.org/images/entities/char_2009.gif) =
=![[thin space (1/6-em)]](https://www.rsc.org/images/entities/char_2009.gif) E0
E0![[thin space (1/6-em)]](https://www.rsc.org/images/entities/char_2009.gif) +
+![[thin space (1/6-em)]](https://www.rsc.org/images/entities/char_2009.gif) (k2)1/(n1−n2)
(k2)1/(n1−n2)![[thin space (1/6-em)]](https://www.rsc.org/images/entities/char_2009.gif) =
=![[thin space (1/6-em)]](https://www.rsc.org/images/entities/char_2009.gif) Emax. The average of A at the temperature T is then given by a Boltzmann weighting including the density of states, i.e.
Emax. The average of A at the temperature T is then given by a Boltzmann weighting including the density of states, i.e.
![[thin space (1/6-em)]](https://www.rsc.org/images/entities/char_2009.gif) >
>![[thin space (1/6-em)]](https://www.rsc.org/images/entities/char_2009.gif) Emax is negligible. We have chosen to define the highest temperature Tmax for which the conversion is acceptable as the temperature giving
Emax is negligible. We have chosen to define the highest temperature Tmax for which the conversion is acceptable as the temperature giving
![[thin space (1/6-em)]](https://www.rsc.org/images/entities/char_2009.gif) <
<![[thin space (1/6-em)]](https://www.rsc.org/images/entities/char_2009.gif) Tmax.
Tmax.![[thin space (1/6-em)]](https://www.rsc.org/images/entities/char_2009.gif) =
=![[thin space (1/6-em)]](https://www.rsc.org/images/entities/char_2009.gif) 3NkBT/2 to the sampled potential energy and it is drawn as big symbols in the upper panel of Fig. 1. As expected, the curves exhibit the typical S-bend around the melting point. Simulation results are fitted to eqn. (20) in a least-square sense and the resulting parameters are given in Table 1. The fitted model caloric curves are also shown as solid lines in Fig. 1. The curves are in good agreement with simulation data and we find that the model DOS describes the thermal behavior of the clusters very well. As a measure of the accuracy of the DOS model, the maximal difference between the potential energy from the simulations and from the model DOS,
3NkBT/2 to the sampled potential energy and it is drawn as big symbols in the upper panel of Fig. 1. As expected, the curves exhibit the typical S-bend around the melting point. Simulation results are fitted to eqn. (20) in a least-square sense and the resulting parameters are given in Table 1. The fitted model caloric curves are also shown as solid lines in Fig. 1. The curves are in good agreement with simulation data and we find that the model DOS describes the thermal behavior of the clusters very well. As a measure of the accuracy of the DOS model, the maximal difference between the potential energy from the simulations and from the model DOS,![[thin space (1/6-em)]](https://www.rsc.org/images/entities/char_2009.gif) =
=![[thin space (1/6-em)]](https://www.rsc.org/images/entities/char_2009.gif) max|Etot,simulation
max|Etot,simulation![[thin space (1/6-em)]](https://www.rsc.org/images/entities/char_2009.gif) −
−![[thin space (1/6-em)]](https://www.rsc.org/images/entities/char_2009.gif) Etot,model DOS|,
Etot,model DOS|,![[thin space (1/6-em)]](https://www.rsc.org/images/entities/char_2009.gif) ×
×![[thin space (1/6-em)]](https://www.rsc.org/images/entities/char_2009.gif) 10−9
10−9![[thin space (1/6-em)]](https://www.rsc.org/images/entities/char_2009.gif) ×
×![[thin space (1/6-em)]](https://www.rsc.org/images/entities/char_2009.gif) 10−69
10−69![[thin space (1/6-em)]](https://www.rsc.org/images/entities/char_2009.gif) ×
×![[thin space (1/6-em)]](https://www.rsc.org/images/entities/char_2009.gif) 10−293
10−293![[thin space (1/6-em)]](https://www.rsc.org/images/entities/char_2009.gif) ×
×![[thin space (1/6-em)]](https://www.rsc.org/images/entities/char_2009.gif) 10−71
10−71![[thin space (1/6-em)]](https://www.rsc.org/images/entities/char_2009.gif) =
=![[thin space (1/6-em)]](https://www.rsc.org/images/entities/char_2009.gif) 3NkBT/2 despite the fact that the rotation and translation were kept to zero. Here, we use the correct expression
3NkBT/2 despite the fact that the rotation and translation were kept to zero. Here, we use the correct expression![[thin space (1/6-em)]](https://www.rsc.org/images/entities/char_2009.gif) =
=![[thin space (1/6-em)]](https://www.rsc.org/images/entities/char_2009.gif) (3N
(3N![[thin space (1/6-em)]](https://www.rsc.org/images/entities/char_2009.gif) −
−![[thin space (1/6-em)]](https://www.rsc.org/images/entities/char_2009.gif) 6)kBT/2,
6)kBT/2,![[thin space (1/6-em)]](https://www.rsc.org/images/entities/char_2009.gif) =
=![[thin space (1/6-em)]](https://www.rsc.org/images/entities/char_2009.gif) max|Ekin,simulation
max|Ekin,simulation![[thin space (1/6-em)]](https://www.rsc.org/images/entities/char_2009.gif) −
−![[thin space (1/6-em)]](https://www.rsc.org/images/entities/char_2009.gif) Ekin,model DOS|,
Ekin,model DOS|,
![[thin space (1/6-em)]](https://www.rsc.org/images/entities/char_2009.gif) −
−![[thin space (1/6-em)]](https://www.rsc.org/images/entities/char_2009.gif) E0)/N]/eV
E0)/N]/eV![[thin space (1/6-em)]](https://www.rsc.org/images/entities/char_2009.gif) ×
×![[thin space (1/6-em)]](https://www.rsc.org/images/entities/char_2009.gif) 10−9
10−9![[thin space (1/6-em)]](https://www.rsc.org/images/entities/char_2009.gif) ×
×![[thin space (1/6-em)]](https://www.rsc.org/images/entities/char_2009.gif) 10−63
10−63![[thin space (1/6-em)]](https://www.rsc.org/images/entities/char_2009.gif) ×
×![[thin space (1/6-em)]](https://www.rsc.org/images/entities/char_2009.gif) 10−70
10−70![[thin space (1/6-em)]](https://www.rsc.org/images/entities/char_2009.gif) ×
×![[thin space (1/6-em)]](https://www.rsc.org/images/entities/char_2009.gif) 10−293
10−293![[thin space (1/6-em)]](https://www.rsc.org/images/entities/char_2009.gif) ×
×![[thin space (1/6-em)]](https://www.rsc.org/images/entities/char_2009.gif) 10−727
10−727


![[thin space (1/6-em)]](https://www.rsc.org/images/entities/char_2009.gif) 000 simulation steps. Lower panel: The potential energy of Pd55 in the course of a MC-CAN simulation is shown at 900 K. Each dot is an average over 1000 simulation steps.
000 simulation steps. Lower panel: The potential energy of Pd55 in the course of a MC-CAN simulation is shown at 900 K. Each dot is an average over 1000 simulation steps.
![[thin space (1/6-em)]](https://www.rsc.org/images/entities/char_2009.gif) 000 simulation steps.
000 simulation steps.![[thin space (1/6-em)]](https://www.rsc.org/images/entities/char_2009.gif) 000 macro steps, one atom in the outermost shell moves out of the shell and becomes a so-called “floater”. (The term was originally used by Cheng et al.50) This atom is shown with a thick grey line to distinguish it from the other atoms. This floater causes the first melting but the cluster immediately switches back to the solid phase again. The second melting, at about 600
000 macro steps, one atom in the outermost shell moves out of the shell and becomes a so-called “floater”. (The term was originally used by Cheng et al.50) This atom is shown with a thick grey line to distinguish it from the other atoms. This floater causes the first melting but the cluster immediately switches back to the solid phase again. The second melting, at about 600![[thin space (1/6-em)]](https://www.rsc.org/images/entities/char_2009.gif) 000 macro steps is not preceded by floaters but is very sudden in character. Thus two kinds of melting is observed. In the simulations, the melting with a preceding floater seems to be most common. All the freezing events (at 450
000 macro steps is not preceded by floaters but is very sudden in character. Thus two kinds of melting is observed. In the simulations, the melting with a preceding floater seems to be most common. All the freezing events (at 450![[thin space (1/6-em)]](https://www.rsc.org/images/entities/char_2009.gif) 000, 750
000, 750![[thin space (1/6-em)]](https://www.rsc.org/images/entities/char_2009.gif) 000, 820
000, 820![[thin space (1/6-em)]](https://www.rsc.org/images/entities/char_2009.gif) 000 and 850
000 and 850![[thin space (1/6-em)]](https://www.rsc.org/images/entities/char_2009.gif) 000 macro steps) are very sudden. The melting seems to be triggered by floaters or defects but we have not observed any special event just before freezing.
000 macro steps) are very sudden. The melting seems to be triggered by floaters or defects but we have not observed any special event just before freezing.
![[thin space (1/6-em)]](https://www.rsc.org/images/entities/char_2009.gif) =
=![[thin space (1/6-em)]](https://www.rsc.org/images/entities/char_2009.gif) 1400 K to Tfinal
1400 K to Tfinal![[thin space (1/6-em)]](https://www.rsc.org/images/entities/char_2009.gif) =
=![[thin space (1/6-em)]](https://www.rsc.org/images/entities/char_2009.gif) 300 K during 100 million steps. The two caloric curves exhibiting hysteresis are shown in Fig. 13. As a matter of fact, the molten cluster never reaches the true solid configuration but a glass configuration of a little higher potential energy. The barrier problem seems to increase with cluster size. The barrier between the phases is indeed expected to increase with cluster size.51
300 K during 100 million steps. The two caloric curves exhibiting hysteresis are shown in Fig. 13. As a matter of fact, the molten cluster never reaches the true solid configuration but a glass configuration of a little higher potential energy. The barrier problem seems to increase with cluster size. The barrier between the phases is indeed expected to increase with cluster size.51
![[thin space (1/6-em)]](https://www.rsc.org/images/entities/char_2009.gif) ×
×![[thin space (1/6-em)]](https://www.rsc.org/images/entities/char_2009.gif) 10−6 K per step.
10−6 K per step.![[thin space (1/6-em)]](https://www.rsc.org/images/entities/char_2009.gif) =
=![[thin space (1/6-em)]](https://www.rsc.org/images/entities/char_2009.gif) −2.76 eV (MC-MICRO, not shown in figure). For Pd34 we regard the onset of atomic mobility as the melting. An equivalent melting phenomenon was reported for Al43 by Sun et al.53
−2.76 eV (MC-MICRO, not shown in figure). For Pd34 we regard the onset of atomic mobility as the melting. An equivalent melting phenomenon was reported for Al43 by Sun et al.53


![[thin space (1/6-em)]](https://www.rsc.org/images/entities/char_2009.gif) =
=![[thin space (1/6-em)]](https://www.rsc.org/images/entities/char_2009.gif) AN−1, where the matrix multiplication is either standard or Boolean. The following definition of a cluster is then equivalent to the one above: If all entries in M are non-zero, the configuration is a cluster, but if any element is zero it is not. The proof is omitted but the result follows physically from the fact that a matrix element in M can only be zero if there is no way to walk between the corresponding atoms in less than N steps between neighboring atoms. The matrix calculation is simple but somewhat time-consuming. In the simulations however, we have the extra information that before the move of one atom, the atoms did form a cluster. With this knowledge, the determination of fragmentation can be done more efficiently.
AN−1, where the matrix multiplication is either standard or Boolean. The following definition of a cluster is then equivalent to the one above: If all entries in M are non-zero, the configuration is a cluster, but if any element is zero it is not. The proof is omitted but the result follows physically from the fact that a matrix element in M can only be zero if there is no way to walk between the corresponding atoms in less than N steps between neighboring atoms. The matrix calculation is simple but somewhat time-consuming. In the simulations however, we have the extra information that before the move of one atom, the atoms did form a cluster. With this knowledge, the determination of fragmentation can be done more efficiently.![[thin space (1/6-em)]](https://www.rsc.org/images/entities/char_2009.gif) =
=![[thin space (1/6-em)]](https://www.rsc.org/images/entities/char_2009.gif) 4.0 Å.
4.0 Å.![[thin space (1/6-em)]](https://www.rsc.org/images/entities/char_2009.gif) 734 CrossRef CAS.
734 CrossRef CAS.![[thin space (1/6-em)]](https://www.rsc.org/images/entities/char_2009.gif) 340 CAS.
340 CAS.![[thin space (1/6-em)]](https://www.rsc.org/images/entities/char_2009.gif) 410 CrossRef CAS.
410 CrossRef CAS.![[thin space (1/6-em)]](https://www.rsc.org/images/entities/char_2009.gif) 222 CrossRef CAS.
222 CrossRef CAS.![[thin space (1/6-em)]](https://www.rsc.org/images/entities/char_2009.gif) 053 CAS.
053 CAS.