


Abstract
Polycyclic Aromatic Hydrocarbons (PAHs) are widely accepted as the carriers of the Aromatic Infrared Bands (AIBs), but an unambiguous identification of any specific interstellar PAH is still missing. For polar PAHs, pure rotational transitions can be used as spectral fingerprints for identification. Combining dedicated experiments, detailed simulations and observations, we explore d the mm wavelength domain to search for specific rotational transitions of corannulene (C20H10). We performed high-resolution spectroscopic measurements and a simulation of the emission spectrum of ultraviolet-excited C20H10 in the environment of the Red Rectangle (RR), calculating its synthetic rotational spectrum. Based on these results, we conducted a first observational campaign at the IRAM 30-m telescope towards this source to search for several high-J rotational transitions of C20H10. The laboratory detection of the J = 112 ← 111 transition of corannulene showed that no centrifugal splitting is present up to this line. Observations with the IRAM 30-m telescope towards the RR do not show any corannulene emission at any of the observed frequencies, down to a rms noise level of Tmb= 8 mK for the J =135 → 134 transition at 137.615 GHz. Comparing the noise level with the synthetic spectrum, we are able to estimate an upper limit to the fraction of carbon locked in corannulene of about 1.0 × 10⁻⁵ relative to the total abundance of carbon in PAHs. The sensitivity achieved in this work shows that radio spectroscopy can be a powerful tool to search for polar PAHs. We compare this upper limit with models for the PAH size distribution, emphasizing that small PAHs are much less abundant than predicted. We show that this cannot be explained by destruction but is more likely related to the chemistry of their formation in the environment of the RR.
1 INTRODUCTION
Polycyclic Aromatic Hydrocarbons (PAHs) have been proposed more than 20 yr ago as an important constituent of the interstellar medium (ISM) (Léger & Puget 1984; Allamandola, Tielens & Barker 1985), being the most likely carriers of the Aromatic Infrared Bands (AIBs), the mid-IR emission features at 3.3, 6.2, 7.7, 8.6, 11.3 and 12.7 μm that dominate the spectra of many interstellar ultraviolet (UV)-excited dusty environments (Allamandola, Tielens & Barker 1989; Léger, d'Hendecourt & Defourneau 1989). PAHs are also thought to be responsible for some of the Diffuse Interstellar Bands (DIBs), more than 300 unidentified absorption features in the UV-visible range observed in the spectra of reddened stars (Léger & d'Hendecourt 1985; van der Zwet & Allamandola 1985). Finally, PAHs are nowadays a crucial ingredient in all models of interstellar extinction by dust, playing the role of the ‘Platt particles’ (Platt 1956; Donn 1968) in contributing to the bump at 220 nm and producing the far-UV rise in the extinction curve (Li & Draine 2001; Cecchi-Pestellini et al. 2008). This has motivated much experimental and theoretical work, but still an unambiguous identification of a single species is missing. This task faces the difficulty that bands in the region of the AIBs, which are associated with vibrations of aromatic C–C and C–H bonds, are common to the whole class of PAHs. It is therefore difficult to use these IR bands to identify single species, even though their study led many authors to obtain information on the nature of their carriers (see e.g. Pech, Joblin & Boissel 2002; Peeters et al. 2002; Berné et al. 2007; Joblin et al. 2008). Vijh, Witt & Gordon (2004, 2005) proposed a tentative identification of neutral pyrene (C16H10) and anthracene (C14H10) towards the Red Rectangle (RR) nebula but this identification was challenged by Mulas et al. (2006c). Recently, Iglesias-Groth et al. (2008) claimed a tentative identification of ionized naphthalene (C10H+8) by the correspondence of three bands from its electronic spectrum with three observed DIBs.
Mulas et al. (2006b) showed that, in principle, it is possible to identify specific interstellar PAHs by the detection of the ro-vibrational emission bands that arise in the far-IR during the cooling cascade following UV excitation. The observation of these bands in the far-IR domain however requires airborne and satellite instruments due to strong atmospheric absorption, and will be one of the goals of the Herschel Space Observatory (HSO).1 On the other hand, the rotational transitions of these molecules fall in the mm domain, and are readily accessible with ground-based radio telescopes.
In a PAH, the absorption of a UV photon generally leads to fast internal conversion of its energy into vibrational energy of the electronic ground state. This energy is then released by ro-vibrational emission in the mid-IR and far-IR range s (cf. e.g. models by Joblin et al. 2002; Mulas et al. 2006a). The intensity of the rotational spectrum scales with the square of the dipole moment but, unfortunately, most common neutral PAHs present very low (or zero) permanent dipole moments. Still there are a few exceptions (Lovas et al. 2005; Thorwirth et al. 2007), and Lovas et al. (2005) proposed that a good PAH candidate for radio identification is corannulene (C20H10), which has a large dipole moment of 2.07 D (see Fig. 1). Thaddeus (2006) conducted a first search for corannulene in the molecular cloud TMC-1 searching for the low-J transitions reported in Lovas et al. (2005). One difficulty with such observational strategy is that free PAHs are expected to be present at the surface of molecular clouds (Boulanger et al. 1990; Rapacioli, Joblin & Boissel 2005; Berné et al. 2007). In these regions, the molecules are excited by UV photons and their rotational spectrum will differ from that of cold molecules excited by collisions (Rouan et al. 1992).
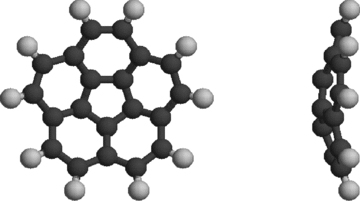
Structure of the corannulene molecule (C20H10). The central pentagonal carbon ring determines the bowl-shaped structure of the molecule, with a permanent dipole moment of 2.07 D along the symmetry axis.
There are several motivations to put further effort into the search for corannulene in space. It is a member of the PAH population and its detection would provide the first firm evidence for the presence of such species in space.
Experimental studies (Lafleur et al. 1993) indicate that corannulene is not a peculiar PAH and that it should not be classified as an unlikely component in natural mixtures. It is indeed expected to constitute a sizeable fraction of a mixture of small PAHs produced by pyrolysis of hydrocarbons which is commonly considered to be the formation pathway of PAHs in C–rich outflows (Frenklach & Feigelson 1989; Cherchneff, Barker & Tielens 1992; Cernicharo et al. 2001). In short, corannulene should be a good tracer of the small PAH population.
Furthermore, with its bowl-shaped geometry, it is also representative of the transition between planar PAHs and curved fullerenes, and several authors have proposed chemical pathways for the formation of C60 involving corannulene (Haymet 1986; Kroto 1988; Chang et al. 1992). The prototype fullerene molecule, C60, has been proposed in its cationic form (C+60) to account for at least two DIBs in the near-IR (Foing & Ehrenfreund 1994; Galazutdinov et al. 2000).
In this paper, we discuss the concerted efforts between modelling and laboratory work that led us to perform a first observational campaign to search for corannulene in UV-irradiated environments. The RR nebula was chosen since it is the brightest source in the AIBs in the sky and because it exhibits emission features at nearly the same wavelengths as some DIBs (Schmidt, Cohen & Margon 1980; Scarrott et al. 1992; Sarre, Miles & Scarrott 1995; Van Winckel, Cohen & Gull 2002), making it a good source for validating the PAH model. Modelling and laboratory work are described in Sections 2 and 3. Observations and data reduction are presented in Section 4, and discussion is provided in Section 5.
2 MODELLING
The emission model for a generic interstellar PAH molecule described in Mulas (1998) has been extended and applied to individual PAHs in Mulas et al. (2006a), where the far-IR spectra for a large sample of PAH species were presented. This model is applied here to calculate the rotational emission spectrum of a C20H10 molecule in the radiation field of the RR halo, as defined in Mulas et al. (2006c), that is the region of the RR nebula which is out of the bipolar cone and out of the dust torus surrounding the central binary system. The model input parameters are the UV-visible absorption cross-section, the vibrational modes and their Einstein A coefficients, the rotational constants and the dipole moment. The rotational constants were taken from Lovas et al. (2005), while the absorption cross-section, the frequencies and the A coefficients of the IR active modes were obtained by state-of-the-art quantum-mechanical calculations (available in the PAH spectral data base http://astrochemistry.ca.astro.it/database, Malloci, Joblin & Mulas 2007). For all other relevant molecular parameters, we used the same assumptions as in Mulas et al. (2006c).
Since calculations are for a single C20H10 molecule, the synthetic spectrum is then scaled in the following way to allow the comparison with the observations.
Any PAH (including corannulene, if present) absorbs energy in the UV proportionally to its UV absorption cross-section, which scales with the number of carbon atoms in the molecule (Joblin, Léger & Martin 1992).
After the absorption of a UV photon, most of this energy is re-emitted in the AIBs. We integrated the AIB flux between 3 and 15 μm measured with the Short Wavelength Spectrograph (SWS) onboard the Infrared Space Observatory (ISO) (Waters et al. 1998) to estimate the energy absorbed by all PAHs in the nebula.
We calculated the expected integrated flux emitted by a single corannulene molecule between 3 and 15 μm, and derived the normalization factor to the flux measured by SWS.
We applied the same normalization factor to the whole spectrum, including the rotational transitions.
The Einstein A coefficients for spontaneous emission in the IR bands are typically between 10−2 and 102 s−1. In case of pure rotational transitions, typical A values are of the order of 10−5–10−7 s−1. Therefore, the IR and rotational emissions are expected to occur at different time-scales. However, the IR cascade can bring the molecule in to a vibrationally excited (metastable) state, where only IR inactive modes are populated. The molecule can therefore spend a non-negligible amount of time in states like this, since their main relaxation channel is via a forbidden vibrational transition. With the modelling parameters adopted, corannulene is estimated to spend roughly 60 per cent of its time in the ground vibrational state, the remaining 40 per cent being divided in a large number of different metastable states. A fraction of the pure rotational emission of the molecule occurs then from such states, in which rotational constants are slightly different from those of the ground vibrational state. Rotational lines from such metastable vibrational states are displaced from those emitted from the ground vibrational state, and do not contribute to the observed line intensity. The estimated time spent in the metastable state depends on the assumed radiation field, and therefore on the spatial distribution of corannulene within the nebula, which we assumed to be in the halo similarly to the observed 11.3 μm emission (Waters et al. 1998). If it is instead located more similarly to the 3.3 μm emission, which is closer to the central source, the photon absorption rate would be higher, the fraction of time spent in the ground state lower. The reverse is true if corannulene is located further away from the source than we assumed. The fraction of time spent in the ground vibrational state depends also on our assumptions for the Einstein coefficients for the IR–inactive modes (Mulas et al. 2006a). If corannulene turned out to have very unusual intensities for electric quadrupole vibrational transitions, with respect to IR-active ones, this would correspondingly change the estimated lifetimes of the metastable states.
The associated emission in the rotational levels is shown in Fig. 2, where a full width at half-maximum (FWHM) of 1 km s−1 is assumed and no scaling factor was applied to account for metastable states. The resulting rotational spectrum is expected to have its most intense lines around 150 GHz and to be spread over a few hundreds GHz with a line spacing of about 1 GHz.
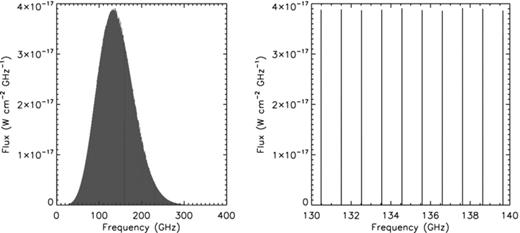
The rotational emission spectrum of corannulene in the RR calculated with the Monte Carlo model peaks around 150 GHz (left-hand panel) and is spread over a few hundreds GHz, with a spacing of about 1 GHz as shown by the zoom of a small region around the maximum (right-hand panel). In the figure, a FWHM of 1 km s−1 has been assumed for the lines. The plot refers to the emission of corannulene molecules situated in the halo of the RR, and has been normalized assuming that all the AIB flux measured by ISO-SWS was due to corannulene.
3 LABORATORY WORK
Corannulene is a polar, symmetric-top PAH with a bowl shaped structure (see Fig. 1). The rotational energy levels of symmetric-top molecules are segregated into series of K-stacks, distinguished by the value of the rotational angular momentum K along the molecular symmetry axis. For parallel bands, the selection rule for the K quantum number is ΔK= 0, so that only levels within the same stack can be connected through a rotational transition. In an ideal rigid symmetric top molecule, the J → J+1 transition has the same frequency along each stack, but in reality centrifugal distortion generally separates the transitions in well resolved lines, the high-J transitions being more affected by this effect. The high-resolution rotational spectrum of corannulene has been measured by Lovas et al. (2005) by Fourier transform microwave spectroscopy (FTMW) up to J = 19 with no K-splitting observed up to this line, leading to an upper limit of ΔJK= 2.3 × 10⁻⁶ for the centrifugal distortion constant. For a radio astronomical detection, higher J transitions (J > 100) are required because of the expected excitation pattern of corannulene by the impinging UV radiation field. It is thus of great importance to know whether K-splitting is still negligible for high-J transitions.
Our laboratory measurements were performed using the Intracavity OROTRON jet spectrometer in Cologne, which is characterized by a frequency range of 112–156 GHz and a frequency resolution of 10–15 kHz (Surin et al. 2001). In this setup, both the millimeter wave generator OROTRON and the supersonic jet apparatus are placed inside a vacuum chamber. Corannulene was prepared by solution phase methods (Sygula et al. 2001) and purified by chromatography on silica gel. The sample was crystalline powder which was evaporated at a temperature of about 170°C, and injected into the OROTRON cavity via a heated pinhole nozzle with Helium as carrier gas. A backing pressure of about 1 bar and a jet repetition rate of 5–10 Hz were used. At 114.18 GHz, a weak spectral feature was recorded after 10 min of integration time, which has been assigned to the J = 112 ← 111 transition of corannulene (see Fig. 3). The central frequency is in agreement with predictions based on the spectroscopic constants obtained from the FTMW measurements to within 250 kHz. The line shows no K-splitting from which can be concluded that the corannulene molecule is very rigid. Therefore, the intensities of different K-stack transitions sum up, enhancing the total intensity of each J → J+1 line by a factor of some tens, depending on the temperature of the gas (Thaddeus 2006). Combining the effects of polarity and the stiffness of the molecule, the intensity of the radio spectrum of corannulene is expected to be 3–4 orders of magnitude stronger than that of a typical polar PAH of the same size and abundance, making corannulene an excellent candidate for radio astronomical detection. The rotational constants derived from the laboratory work have been used to refine the band positions given in the synthetic spectrum. For the measurement of the corannulene line described in this paper, 30 mg of corannulene had to be spent. Further laboratory measurements in the mm-waveband are in progress and will be described in more detail elsewhere (Herberth, Giesen, in preparation).
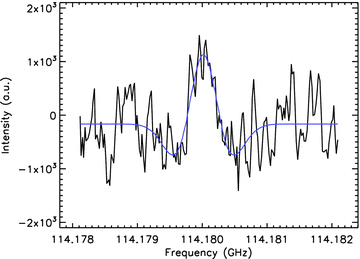
The line detection at 114.18 GHz measured in the laboratory with the OROTRON jet spectrometer, assigned to the J = 112 ← 111 transition of corannulene.
4 SOURCE DESCRIPTION AND OBSERVATIONS
The RR is a biconical C-rich nebula which surrounds a post-asymptotic giant branch (AGB) binary system composed of the primary star HD 44179 (spectral type A0) and its luminous giant companion. It has been observed in the mid-IR with the SWS instrument onboard ISO and with the Infrared Spectrograph (IRS) onboard the Spitzer Space Telescope. The dimensions on the plane of the sky of the infrared bipolar nebula at 11.3 μm are about 10 × 20 arcsec2 (Waters et al. 1998). A warm, high density disc (nH > 3 104 cm−3, 30 K < T < 400 K) traced by CO emission (Bujarrabal et al. 2005) surrounds the binary star with a thickness of roughly 3 arcsec along the symmetry axis.
Observations were performed with the IRAM 30-m telescope in Pico Veleta in 2008 February. The observed frequency ranges cover several high-J transitions of C20H10 at 1, 2 and 3 mm. Weather conditions were acceptable for most of the time. We used the wobbling secondary observing mode, with a beam separation of ±100 arcsec in azimuth. This observing mode ensures stable and flat baselines and is well adapted to compact sources such as the RR.
Pointing was made on the central binary star HD44179 (α2000: 06:19:58.216, δ2000: −10:38:14:691). Mars and Orion (α2000: 05:35:14.5, δ2000: −05:22:30.00) were used as reference sources for calibration and pointing. Pointing was accurate within 3 arcsec during all observations. The flexibility of the four receivers and of the VESPA correlator allowed to cover several frequency ranges within one configuration, with a spectral resolution of 40 kHz and a total band pass of at least 40 MHz. We also used the 1 MHz resolution filter banks to obtain broad-band spectra (250 MHz) with lower spectral resolution. During all observations, one of the back ends was dedicated to the 13CO (1–0), (2–1) or 12CO(2–1) transition, to check whether the telescope was pointed on source, and to monitor the calibration accuracy. The observed 12CO intensity and line width are in good agreement with previous observations of the RR with the IRAM 30-m telescope reported in Jura, Balm & Kahane (1995). The summary of the 12CO and 13CO observations are reported in Table 1.
Summary of 12CO and 13CO observations towards the RR.
| Transition (J+1 → J) | Frequency (GHz) | Beam size (arcsec) | Beff | Tsys (K) | Area (K km s−1) | Bandwidth (MHz) |
| 12CO (2 → 1) | 230.538 | 10 | 0.52 | 486 | 6.8 | 40 |
| 13CO (1 → 0) | 110.201 | 22 | 0.75 | 159 | 0.3 | 40 |
| 13CO (2 → 1) | 220.398 | 11 | 0.55 | 339 | 1.7 | 40 |
| Transition (J+1 → J) | Frequency (GHz) | Beam size (arcsec) | Beff | Tsys (K) | Area (K km s−1) | Bandwidth (MHz) |
| 12CO (2 → 1) | 230.538 | 10 | 0.52 | 486 | 6.8 | 40 |
| 13CO (1 → 0) | 110.201 | 22 | 0.75 | 159 | 0.3 | 40 |
| 13CO (2 → 1) | 220.398 | 11 | 0.55 | 339 | 1.7 | 40 |
To improve the quality of the observed spectra, we manually cut isolated spikes out of 4σ (the two nearest channels being lower than 3σ), and discarded observations with anomalous system temperature or with a high sky opacity. Different observations of the same transitions were averaged, and the antenna temperature was scaled with the telescope main beam efficiency by the relation Tmb=T*A/ηmb, where ηmb=Feff/Beff. The central frequency, beamwidth, beam efficiency, system temperature, rms level and bandwidth are reported in Table 2 for each of the observed frequency ranges. The expected flux derived from the synthetic spectrum and the 3σ detection limit corrected for beam dilution are also reported for the corannulene observations. The rms level was calculated after smoothing the spectra to the velocity resolution of 0.4 km s−1. In Fig. 4, we show the observed spectra in the regions where the 135 → 134 and 86 → 85 transitions of C20H10 are expected, and the 12CO and 13CO observations (further plots can be found in the electronic version of the article – see Supporting Information). We did not detect any corannulene line at any frequency. The best rms level for corannulene has been obtained for the transitions J+1 → J = 135 → 134, 84 → 83 and 86 → 85.
Summary of the observations towards the RR in different frequency ranges, corresponding to the expected rotational transitions of corannulene. On average, the 3 mm observations have a lower rms, but suffer more from beam dilution effects compared to the 1 mm observations.
| Transition (J+1 → J) | Frequency (GHz) | Beam size (arcsec) | Beff | Tsys (K) | σmb (mK) | Bandwidth (MHz) | F3σ (10−25 W cm−2) | Fmodel (10−21 W cm−2) |
| 84 → 83 | 85.643 | 29 | 0.78 | 117 | 10 | 80 | 1.4 | 5.7 |
| 86 → 85 | 87.682 | 28 | 0.77 | 107 | 12 | 80 | 1.7 | 6.2 |
| 108 → 107 | 110.104 | 22 | 0.75 | 170 | 14 | 80 | 1.6 | 13 |
| 111 → 110 | 113.316 | 22 | 0.74 | 276 | 21 | 120 | 2.3 | 14 |
| 135 → 134 | 137.615 | 17 | 0.70 | 219 | 8 | 80 | 0.9 | 19 |
| 215 → 214 | 219.059 | 11 | 0.55 | 346 | 45 | 80 | 5.4 | 5.3 |
| 216 → 215 | 220.076 | 11 | 0.54 | 328 | 20 | 80 | 2.4 | 5.2 |
| 223 → 222 | 227.197 | 11 | 0.53 | 269 | 23 | 80 | 2.9 | 4.0 |
| 226 → 225 | 230.248 | 11 | 0.52 | 389 | 30 | 80 | 3.8 | 3.7 |
| 238 → 237 | 242.450 | 10 | 0.50 | 525 | 22 | 80 | 2.8 | 2.3 |
| 257 → 256 | 261.763 | 8 | 0.46 | 546 | 39 | 40 | 5.4 | 0.9 |
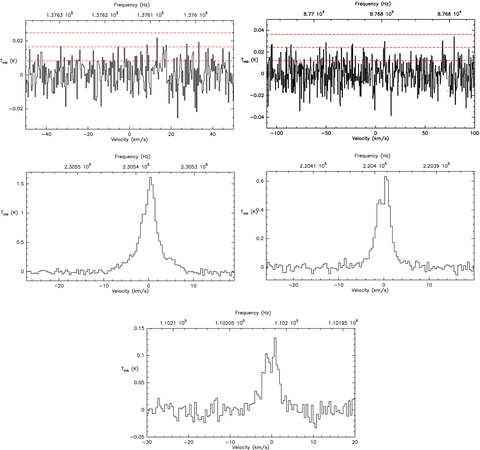
Observations of the expected frequency range for the 135 → 134 transition at 137 GHz, the 86 → 85 transition at 88 GHz of C20H10, the 12CO(1–0) and 13CO(1–0), (2–1) transitions. Horizontal red lines indicate the first 3σ levels. See the electronic version of the article (Supporting Information) for further plots.
5 RESULTS AND DISCUSSION
To calculate an upper limit to the abundance of corannulene in the source, we assumed a 3σ detection limit and a Gaussian profile with a FWHM of 1 km s−1. Before comparing the observed rms to the model, we have to take into account the effect of beam dilution. As a first approximation, we assume that PAH emission is distributed homogeneously in a 20 × 10 arcsec2 area as observed for AIB emission (Waters et al. 1998).
The best noise levels are reached, on average, with the 3 mm observations, but the 1 and 2 mm observations suffer less from beam dilution. To compute a reliable upper limit to the abundance of corannulene, we chose the 135 → 134 transition at 2 mm, which is not only the transition with the lowest rms, but also the best compromise between the loss of flux due to beam dilution and expected intensity derived from the synthetic spectrum.
The synthetic spectrum has been normalized as if all the AIB flux was due to corannulene, as explained in Section 2. The ratio between observations and theoretical predictions can be turned into an upper limit for the fraction of AIB flux due to corannulene, which corresponds to the fractional abundance of carbon locked up into corannulene relative to the total abundance of carbon in PAHs. The synthetic spectrum predicts for the 135 → 134 transition an integrated flux of Fmodel= 1.9 × 10⁻²⁰ W cm−2. We compare this value with the area of the 3σ Gaussian for the same transition, corrected for beam dilution: F3σ= 9.0 × 10⁻²⁶ W cm −2.
An upper limit for the fraction of carbon in C20H10 compared to the total abundance of carbon locked in PAHs can be obtained by the ratio F3σ/Fmodel. This ratio has to be modified to take into account the fact that emitting C20H10 is not always in its ground state. An average factor of 0.6 was derived in Section 2. Also, the resulting estimate applies for the C20H10 main isotope. Different isotopologues have slightly different rotational constants, which have rotational lines in displaced positions. Assuming standard Solar system isotopic ratios and no fractionation, about 25 per cent of corannulene molecules are expected to contain one or more 13C atoms which results in an additional correction. Substitutions of 1H with 2D occur in a negligible fraction of the molecules. In a circumstellar envelope around a post-AGB star, isotopic ratios depend on the detailed history of the last phases of its precursor, and can be significantly different from the accepted solar values. For the RR, recent observations however failed to detect isotopomers of C2, CN and CH containing 13C, setting a lower limit of 22 for the 12C/13C ratio in the RR nebula (Bakker et al. 1997). Assuming this ratio, instead of the standard value of 89, would result in a factor of 1.7 for our final lower limit on the abundance and column density of corannulene. Given that the 12C/13C ratio in the RR must be ≥22, this does not significantly alter our conclusions.
With these assumptions, and solar 12C/13C ratio, we derive a value of 1.0 × 10⁻⁵ as our best limit for the fraction of carbon in C20H10 relative to the total carbon in all PAHs. Assuming that ∼20 per cent of total carbon atoms are locked in PAHs (Joblin et al. 1992; Tielens 2005), this turns into a value of 2.0 × 10⁻⁶ of total carbon in corannulene. This result is much more stringent than the limit derived by Thaddeus (2006) for corannulene in TMC-1, 1 × 10⁻⁵.
This can be compared with the models of the size distributions of interstellar PAHs in the literature. With a the PAH radius, Désert, Boulanger & Puget (1990) used a size distribution NPAH(a) ∝a−2 whereas Draine & Lazarian (1998) proposed a lognormal distribution. Assuming that the fraction of carbon locked in PAHs relative to hydrogen is 6 × 10⁻⁵ (Joblin et al. 1992; Li & Draine 2001), we can use the derived upper limit to constrain the corannulene abundance (relative to hydrogen) to be  .
.
Fig. 5 shows both distributions using the relation  Å for compact molecules (Omont 1986) and normalizing the carbon content in PAHs to 6 × 10⁻⁵ relative to hydrogen. In the figure, the distributions are represented as histograms with a bin size of 1 in NC, to be directly comparable with the upper limits derived for corannulene (this work) and for the larger species C42H18 that has been measured in the visible range for the diffuse ISM (Kokkin et al. 2008). It is difficult to assess the significance of such a straight comparison, however, since on one side we have a specific molecule and its abundance, on the other side we have the summed abundance of all PAHs in the same size bin. This would involve considering all isomers with the same chemical formula, and assuming some relative abundances among them. In the absence of more specific information, we will use the experimental results cited in Section 1 about the minimum mass fraction of corannulene that is always formed in pyrolysis experiments. In the chromatograms of the aromatic species produced in such flames, a few tens of species appear to constitute most of the mixture of molecules with less than 100 C atoms, fewer than 10 of them being by far more abundant (Lafleur et al. 1993).
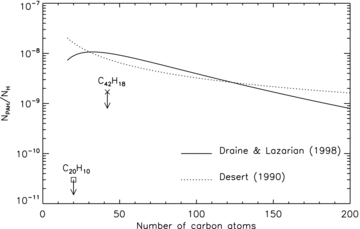
Size distributions of PAHs according to Désert et al. (1990) and Draine & Lazarian (1998), normalized to a carbon abundance in PAHs of 6 × 10⁻⁵ relative to hydrogen (Joblin et al. 1992; Draine & Lazarian 1998). The two upper limits reported refer to the observations of corannulene in the RR (this paper) and of C42H18 in the diffuse ISM (Kokkin et al. 2008). The discrepancy between models and observations supports the photodestruction of small PAHs in space.
Using the PAH spectral data base (Malloci et al. 2007), we determined that, for neutral PAHs, there is a tight linear correlation (correlation coefficient r= 0.94) between the number of carbon atoms and the absorbance integrated in the (236–500) nm range used by the chromatogram in fig. 3 of Lafleur et al. (1993). This means that we can use these integrated absorbances to quantify NC for each identified PAH in that chromatogram. We then derived the mass fraction of pyrene compared to all PAHs, and that of corannulene, assuming it corresponds to 1 per cent of the pyrene mass, which is the lowest value reported by Lafleur et al. (1993). This leads to a lower limit of ∼4 × 10⁻⁴ for the fraction in mass of corannulene in the mixtures of small PAHs produced in such experiments. Together with our observational upper limit on the fraction of carbon atoms in corannulene with respect to the total in all PAHs, this yields an upper limit of ∼2 per cent for the mass fraction of small PAHs with respect to the total (3.4 per cent assuming the lower limit for 12C/13C). Integrating the two size distributions (see Fig. 5) in the small molecule range (NC≤ 50) leads to a fraction of carbon in small PAHs versus the total of ∼19 per cent, an order of magnitude larger than our upper limit. Based on the general assumption that the formation of PAHs in evolved stars can be described by flame chemistry (cf. Section 1), we can conclude that small PAHs in the RR are significantly less abundant than the values predicted by the size distributions reported in Fig. 5.
The underabundance of small PAHs in the RR can be due either to selective destruction of small-sized PAHs (Allain, Leach & Sedlmayr 1996b,a; Le Page, Snow & Bierbaum 2003) or to the fact that PAHs grew to larger sizes directly in the C-rich outflow of the RR nebula progenitor where they were originally synthesized. Interestingly, the analysis of observations of the 3.3 μm AIB and its overtone at 1.68 μm in the young planetary nebula IRAS 21282+5050 showed that PAHs emitting in these bands contain about 60 C (Geballe et al. 1994). This rises the question of the minimum size of PAHs that are formed in evolved stars, an important issue considering that these PAHs also appear to be the parental species of interstellar PAHs (Joblin et al. 2008).
To determine whether photodissociation can destroy small PAHs in the RR halo, we estimated the rate of the dominant photodissociation channel for corannulene, namely the loss of an H atom, as a function of the internal energy U. This dissociation rate kd(U) was calculated using the results on the coronene cation (C24H+12) from the PIRENEA set-up (Joblin et al., in preparation), and including corrections for the variation of the density of states between C20H10 and C24H+12[cf. formula (7) in Boissel et al. (1997)]. We combined this rate with the distribution of excitation energies of C20H10 in the RR halo obtained from the Monte Carlo simulation discussed above. Multiplying the two and integrating, we obtained a photodissociation rate of ∼1.1 × 10⁻⁸ s−1, corresponding to a lifetime of ∼2.9 yr. The reaction rate of dehydrogenated corannulene with H can be estimated at a value of at least 2 × 10⁻⁵ s−1, using a rate coefficient of ∼2 × 10⁻¹⁰ cm3 s−1 (Le Page et al. 1999) and a hydrogen density larger than 105 cm−3 (Men'shchikov et al. 2002). This is several orders of magnitudes larger than the dissociation rate. Therefore, corannulene is expected to survive in its neutral hydrogenated form in the RR nebula.
From this work, we can conclude that radio spectroscopy can be a powerful tool to detect specific polar PAHs. Our results in the RR show that it can also be an efficient way to constrain the abundance of small PAHs. Our analysis of these results suggests that the underabundance of small PAHs in the RR is related to the production mechanism for these species and not to subsequent UV destruction. This conclusion will have to be further tested by both observations in other environments and by laboratory studies on the formation of PAHs in conditions that mimic the environment of evolved carbon stars.
We thank the referee for his useful comments. This work was supported by the European Research Training Network Molecular Universe (MRTN-CT- 2004-512302), and the CNRS PICS 4260 ‘Croissance et destruction des macromolécules carbonées interstellaires’, which are acknowledged. PP acknowledges also financial support from the Master & Back program of the ‘Regione Autonoma della Sardegna’. Financial support from the U.S. National Science Foundation (Department of Energy), the Deutsche Forschungsgemeinschaft and the Land Niedersachsen are also gratefully acknowledged. GM and GM acknowledge financial support by MIUR under project CyberSar, call 1575/2004 of PON 2000-2006.
REFERENCES
Supporting Information
Additional Supporting Information may be found in the online version of this article:
Fig. A1. Observations of the expected frequency range for the pure rotational transitions of corannulene J +1 → J: 108 → 107, 111 → 110, 215 → 214 and 216 → 215.
Fig. A2. Observations of the expected frequency range for the pure rotational transitions of corannulene J +1 → J: 223 → 222, 226 → 225, 238 → 237 and 257 → 256.
Please note: Wiley-Blackwell are not responsible for the content or functionality of any supporting information supplied by the authors. Any queries (other than missing material) should be directed to the corresponding author for the article.
