Issue 11, 2013

Power graph compression reveals dominant relationships in genetic transcription networks

Abstract

We introduce a framework for the discovery of dominant relationship patterns in transcription networks, by compressing the network into a power graph with overlapping power nodes. Our application of this approach to the transcription networks of S. cerevisiae and E. coli, paired with GO term enrichment analysis, provides a highly informative overview of the most prominent relationships in the gene regulatory networks of these two organisms.
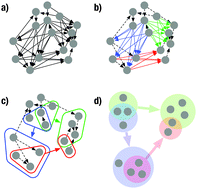
Graphical abstract: Power graph compression reveals dominant relationships in genetic transcription networks

Supplementary files

Article information

Article type
Paper
Submitted
18 Jun 2013
Accepted
07 Aug 2013
First published
08 Aug 2013

Mol. BioSyst., 2013,9, 2681-2685

Power graph compression reveals dominant relationships in genetic transcription networks

S. E. Ahnert, Mol. BioSyst., 2013, 9, 2681 DOI: 10.1039/C3MB70236G

To request permission to reproduce material from this article, please go to the Copyright Clearance Center request page.

If you are an author contributing to an RSC publication, you do not need to request permission provided correct acknowledgement is given.

If you are the author of this article, you do not need to request permission to reproduce figures and diagrams provided correct acknowledgement is given. If you want to reproduce the whole article in a third-party publication (excluding your thesis/dissertation for which permission is not required) please go to the Copyright Clearance Center request page.

Read more about how to correctly acknowledge RSC content.

Spotlight

Advertisements