DOI:
10.1039/C7RA03598E
(Paper)
RSC Adv., 2017,
7, 28438-28451
Site selective substitution and its influence on photoluminescence properties of Sr0.8Li0.2Ti0.8Nb0.2O3:Eu3+ phosphors†
Received
28th March 2017
, Accepted 19th May 2017
First published on 30th May 2017
Abstract
Perovskite red phosphors Sr0.95−xEu0.05LixTi1−xNbxO3 (0 ≤ x ≤ 0.3), Sr0.8−xLi0.2Ti0.8Nb0.2O3:xEu3+ (0 ≤ x ≤ 0.16) and Sr0.8−x/2Li0.2Ti0.8−x/2Nb0.2O3:xEu3+ (0 ≤ x ≤ 0.16) were prepared by solid state reaction. The influence of increase of Eu3+ concentration and effect of altering substitution sites of Eu3+ ions from A-sites to simultaneously at A- and B-sites of the host lattice on the photoluminescence properties of the phosphors were investigated. The site selective substitution of Eu3+ ions is described with changes in cell volume obtained from X-ray diffraction patterns, Raman shifts and the decay curve profiles obtained from luminescence life time measurements. From the Raman spectra it is found that simultaneous substitution of Eu3+ ions at A- and B-sites increases the intensity of first order TO2, TO4 and LO4 vibrational modes at 184, 541 and 811 cm−1 and the first order R-point vibrations at 147, 229 and 449 cm−1 significantly, indicating excess defect concentration. The single exponential luminescence decay curves observed for Sr0.8−xLi0.2Ti0.8Nb0.2O3:xEu3+ phosphors reveal A-sites occupancy and the double exponential nature of decay curves of Sr0.8−x/2Li0.2Ti0.8−x/2Nb0.2O3:xEu3+ phosphors confirm the simultaneous occupancy of europium at A- and B-sites. Interestingly we observed a sharp increase in asymmetric ratio between the electric and magnetic dipole transitions 5D0 → 7F2 and 5D0 → 7F1, from 2.09 to 4.09, on doubling the substitution sites of Eu3+ resulting in enhanced color purity. It is found that simultaneous substitution increases the intensity of red emission at 615 nm, under optimum doping conditions, by 1.46 times. Further, from Judd–Ofelt analysis, J–O intensity parameter Ω2 is found to increase from 3.67 × 10⁻²⁰ to 4.80 × 10⁻²⁰ cm2, on altering substitution of Eu3+ from A-sites to A- and B-sites simultaneously, substantiating the increase of local asymmetry in the lattice. The radiative and non-radiative transition rates, radiative life time, branching ratios and stimulated emission cross sections of all these phosphors are also reported. The color coordinates are described with CIE chromaticity diagram. Color purity and color temperature of these phosphors are also described in detail.
1. Introduction
Rare earth elements find a variety of optical applications such as in white light emitting diodes (WLEDs), fluorescent lamps, display devices, photonic devices, solid state lasers, and biological labeling.1,2 The field of solid state lighting applications like phosphor converted WLEDs is in need of new thermally and chemically stable high quantum yield red phosphors which absorb UV and visible radiations for producing white light of appropriate color rendering index (CRI) and correlated color temperature (CCT).3 The Eu3+ ion is an essential activator for many inorganic lattices to produce orange-red emission by the transitions 5D0 → 7FJ, J = 0, 1, 2, 3.4 Eu3+ can also be used as a structural probe since its absorption and emission spectrum depends on its site symmetry in the host lattice.5 In a crystal site with inversion symmetry, the magnetic dipole transition (5D0 → 7F1) of Eu3+ (∼590–600 nm) is dominant. As the symmetry of site deviates from its ideal form due to the incorporation of a dopant ion or changes in the ligand field surrounding the fluorescing ion, the electric dipole transition (5D0 → 7F2) becomes dominant, which give rise to enhanced red emission (∼610–630 nm). An important strategy to achieve excellent luminescence is the selection of a suitable host for the rare earth ion. Perovskite oxides with general formula ABO3 have been termed as inorganic chameleons because of the flexibility of their structure to accommodate different sized ions by deviating from the cubic structure and thus to exhibit variety of physical and chemical properties. It has already been reported that required property improvement can be obtained by substitution and/or doping of individual and mix ions of varying sizes and valances at A- and B-sites.6,7 High stability of perovskite structure offers substitution of ions at A and B sites independent of their valances and is exploited by many researchers recently. Crystal chemical tuning in these materials, accomplished through doping of lanthanide ions in both A and B sites induces large change in chemical and physical properties. Tuning bulk electrical properties, photo catalytic water splitting, persistent luminescence, self-activated luminescence and transition metal and rare earth (RE) activated luminescence by controlling the local environment around A- and B-cations in perovskites and other complex oxides is a frontier area of research.6,8–11 The ideal cubic perovskite structure has smaller cation in 6-fold co-ordination surrounded by an octahedron of anions and larger cations in 12-fold cuboctahedral coordination. SrTiO3 (STO) is an extensively studied cubic perovskite material due to its excellent ferroelectric, magnetic, dielectric, thermoelectric and photocatalytic properties.11,12 STO can be considered as a good host for RE ions because of its wide band gap, high refractive index and low phonon energy. Doping mechanism experiments done by substituting dopant ions viz., transition metals like Mn2+ and rare earths ions of Pr3+, Nd3+, Sm3+, Gd3+, Dy3+, Er3+ and Yb3+in A and B sites of STO separately revealed that substituting position has major effect on ferroelectric transition temperature and dielectric behavior.13,14
Here, we made an attempt to enhance the photo luminescence properties of SrTiO3:Eu3+ by preparing a solid solution host of perovskite compounds SrTiO3 and LiNbO3 (LNO). Solid solution compounds provide new structural possibilities concerning metal ion co-ordination environment. Energy absorption abilities of host material can be tailored by preparing solid solution of mixed valent perovskites through modification of energy band structure for color tuning of emission, enhancing emission intensity to get a better quantum yield and/or for improving chemical stability.15,16 LNO, a perovskite material with trigonal structure, has very low optical losses and very high value of the main electro-optical coefficient and nonlinear coefficient. They are the most preferred materials for electrically driven light generators, scanners and modulators in integrated optics and most important nonlinear material in photonics.17 Being a low phonon energy material, LNO can increase the radiative transitions between energy levels.18 Hence the substitution of LNO is done here with the intension to improve the luminescence properties. We optimized the concentration of LNO as 20 mol%, showing better luminescence properties and phase purity.
In this work Sr0.95−xEu0.05LixTi1−xNbxO3 (x = 0, 0.05, 0.1, 0.2 and 0.3), Sr0.8−xLi0.2Ti0.8Nb0.2O3:xEu3+ (x = 0.05, 0.08, 0.12, 0.16, and 0.20) and Sr0.8−x/2Li0.2Ti0.8−x/2Nb0.2O3:xEu3+ (x = 0.05, 0.08, 0.12, 0.16, and 0.20) were prepared by solid state reaction method. At first, the phosphor was prepared by substituting Eu3+ ions at A-sites and then preparation was done by substituting Eu3+ ions at A- and B-sites simultaneously. The site selective substitution is done here to explore relationship between the change in photoluminescence properties and alteration of structure around the activator ions. A variety of spectroscopic techniques and X-ray diffraction measurements were used to investigate the influence of site selective substitution. Judd–Ofelt analysis is used to analyze luminescence and radiative properties of phosphors.
2. Experimental section
The perovskite compounds Sr0.95−xEu0.05LixTi1−xNbxO3 (x = 0, 0.05, 0.1, 0.2 and 0.3), Sr0.8−xLi0.2Ti0.8Nb0.2O3:xEu3+ (x = 0, 0.05, 0.08, 0.12, 0.16, and 0.20) and Sr0.8−x/2Li0.2Ti0.8−x/2Nb0.2O3:xEu3+(x = 0.05, 0.08, 0.12, 0.16, and 0.20) were synthesized by conventional solid state method using the starting materials Li2CO3, SrCO3, TiO2, Nb2O5 and Eu2O3 (Sigma Aldrich – 99.99%). The raw materials were mixed in proper stoichiometry and then homogenized by wet mixing with acetone in an agate mortar for 30 min. The products obtained after wet mixing was calcined using alumina crucibles in an electric furnace at the temperature of 1250 °C for 6 hours with intermittent grinding. The heating of the furnace was programmed to increase the temperature initially at 10 °C min−1 up to 700 °C and afterwards the heating rate was decreased to 5 °C min−1. The calcined samples were ground to fine powders for further characterizations.
X-ray powder diffraction analysis was performed with diffractometer having Ni filtered Cu-Kα radiation (λ = 1.5405 Å) varying 2θ from 10 to 90° in 0.02 steps. X'Pert HighScore Plus programme was used for Rietveld refinement of X-ray diffraction patterns for structural analysis. The crystal structure of cubic SrTiO3 with pm3m space group (no. 221) was used as the starting model for all the samples with A, B and oxygen ions at the Wyckoff sites 1b, 1a and 3d respectively. Raman spectra were recorded in a back scattering geometry using a confocal micro Raman spectrometer system (Horiba Jobin – Yvon LABRAM-HR 800) equipped with a Peltier cooled CCD detector. The elemental analysis and elemental X-ray dot mapping was carried out by FEI-Nova nano SEM 450 field emission scanning electron microscope. Structural properties were analysed by JEOL JEM2100 transmission electron microscope. FTIR transmittance spectra were obtained from JASCO4100 FTIR spectrometer and UV-visible diffuse reflectance spectra from JASCO V-550 spectrophotometer. The photoluminescence spectra and lifetime measurements of samples were obtained by Jobin Yvon FLUOROLOG FL3-11 spectrofluorimeter and the PL measurements of all the prepared phosphors were done at a time by taking equal quantity of samples, to compare luminescence intensity.
3. Results and discussion
3.1 Structural, morphological and photoluminescence studies
Powder XRD patterns of Sr0.95−xEu0.05LixTi1−xNbxO3 (x = 0, 0.05, 0.1, 0.2 and 0.3) and Sr0.8−xLi0.2Ti0.8Nb0.2O3:xEu3+ [SL1, A-site substituted] and Sr0.8−x/2Li0.2Ti0.8−x/2Nb0.2O3:xEu3+ [SL2, A- and B-sites simultaneously substituted], with x = 0, 0.05, 0.08, 0.12 and 0.16 of phosphor samples are shown in Fig. S1(a),† 1(a) and (b) respectively. All the X-ray diffraction patterns are indexed according to the JCPDS card no. 89–4934 (space group pm3m) of cubic strontium titanium oxide. The samples are found to be polycrystalline and no peaks other than that of SrTiO3 were found in these patterns. This indicates that these samples are single phased and substitution of LNO and Eu3+ does not activate any significant change in the crystal structure. However in the X-ray diffraction patterns of samples with excess europium, x > 0.16, additional peaks corresponding to europium compounds were observed (not shown). The observed peak shifts due to increase in lattice parameter with LNO incorporation (Fig. S1(a)†) in Sr0.95−xEu0.05LixTi1−xNbxO3 indicates expansion of unit cell, which is in agreement with the earlier reports.19 The appearance of small shoulder in the reflection peaks for x = 0.30, as evidenced by the expanded view of (110) reflection specifies that the symmetry of crystalline samples lowers from cubic structure when concentration of LiNbO3 exceeds 20 mol% (Fig. S1(b)†). Perovskite structures are stable when RE ions are doped at A- and/or B-sites.20 Samples SL1 and SL2 are prepared considering inclusion of Eu3+ ions at A-site and simultaneously both at A- and B-sites respectively. The peak shift observed with different Eu contents, for both type of substitutions is shown in Fig. 1(c) and (d).
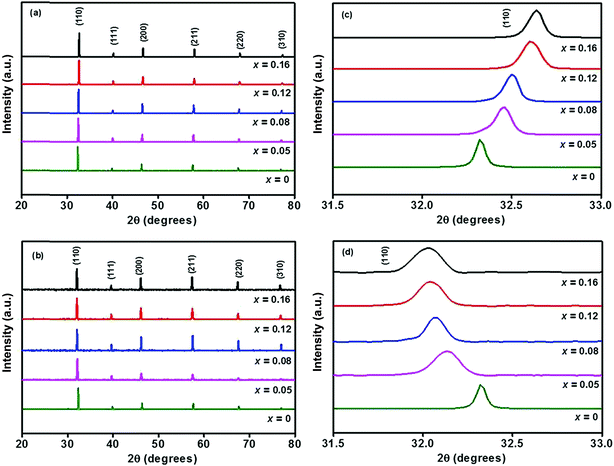 |
| | Fig. 1 XRD patterns of (a) Sr0.8−xLi0.2Ti0.8Nb0.2O3:xEu3+ (SL1) and (b) Sr0.8−x/2Li0.2Ti0.8−x/2Nb0.2O3:xEu3+ (SL2) phosphors, expanded view of (110) reflection of (c) SL1 and (d) SL2. | |
In order to detect the modifications on the structural parameters as a result of Eu3+ doping, Rietveld analysis of X-ray diffraction patterns of all the samples were done. Fig. 2 shows the best fitted pattern of the observed, calculated and difference curves and the Bragg positions of Sr0.74Eu0.12Li0.2Ti0.74Nb0.2O3 (SL2c) phosphor. Lattice parameter, unit cell volume, bond distances and R-factors of SL1 and SL2 type phosphors prepared with europium content, x = 0.12 (SL1c and SL2c respectively) for which the luminescence emission intensity was maximum, along with that of SrTiO3 (ST) and Sr0.8Li0.2Ti0.8Nb0.2O3 (SL) are depicted in the Table 1. The structural parameters for all SL1 and SL2 phosphors with different compositions is given in Table S1.† The refinements of the samples converges well with the observed XRD patterns only when the site occupancy factor (sof) for Eu at 1b and 1a Wyckoff sites are 100% and 0% respectively for SL1 phosphors and 50% each at 1b and 1a sites for SL2 phosphors. This evidences the occupancy ratio of Eu3+ ions as 1![[thin space (1/6-em)]](https://www.rsc.org/images/entities/char_2009.gif) :
:![[thin space (1/6-em)]](https://www.rsc.org/images/entities/char_2009.gif) 0 for SL1 and 1
0 for SL1 and 1![[thin space (1/6-em)]](https://www.rsc.org/images/entities/char_2009.gif) :
:![[thin space (1/6-em)]](https://www.rsc.org/images/entities/char_2009.gif) 1 for SL2 phosphors at Sr2+ and Ti4+ sites. In the case of SL1, the lattice parameter (a) reduces from 3.9115(1) to 3.9006(1) and cell volume contracts about 0.72% and for SL2, the lattice parameter increases from 3.9115(1) to 3.9175(1) and unit cell volume expands about 0.57% when europium content is increased from 0 to 16 mol% (Fig. 3). These changes in the cell volume are reflected in the Sr–O and Ti–O bond distances. Considering the ionic radii of Sr2+ ions (1.44 Å, CN 12) and Li+ ions (0.92 Å, CN 8) positioned at the A-sites and Ti4+ ions (0.605 Å, CN 6) and Nb5+ ions (0.640 Å, CN 6) at B-sites, contraction of unit cell observed for SL1 proposes the possibility of entering Eu3+ ions (0.947 Å, CN 6) in A-site replacing Sr2+ ions.11,21,22 In the case of SL2, the observed expansion of cell volume is a clear indication of occupancy of Eu3+ ions at the sites of smaller Ti4+ ions (B-sites) in addition to the most favorable A-site occupancy.11,19,20 The substitution of Eu3+ ions at Nb5+ sites is excluded here by considering the fact that concentration of Nb5+ is only 4 times less than that of titanium and strontium in these systems.
1 for SL2 phosphors at Sr2+ and Ti4+ sites. In the case of SL1, the lattice parameter (a) reduces from 3.9115(1) to 3.9006(1) and cell volume contracts about 0.72% and for SL2, the lattice parameter increases from 3.9115(1) to 3.9175(1) and unit cell volume expands about 0.57% when europium content is increased from 0 to 16 mol% (Fig. 3). These changes in the cell volume are reflected in the Sr–O and Ti–O bond distances. Considering the ionic radii of Sr2+ ions (1.44 Å, CN 12) and Li+ ions (0.92 Å, CN 8) positioned at the A-sites and Ti4+ ions (0.605 Å, CN 6) and Nb5+ ions (0.640 Å, CN 6) at B-sites, contraction of unit cell observed for SL1 proposes the possibility of entering Eu3+ ions (0.947 Å, CN 6) in A-site replacing Sr2+ ions.11,21,22 In the case of SL2, the observed expansion of cell volume is a clear indication of occupancy of Eu3+ ions at the sites of smaller Ti4+ ions (B-sites) in addition to the most favorable A-site occupancy.11,19,20 The substitution of Eu3+ ions at Nb5+ sites is excluded here by considering the fact that concentration of Nb5+ is only 4 times less than that of titanium and strontium in these systems.
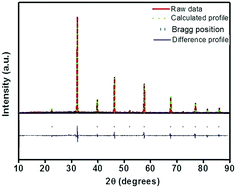 |
| | Fig. 2 Rietveld refinement of X-ray diffraction pattern of Sr0.74Eu0.12Li0.2Ti0.74Nb0.2O3 (SL2c) phosphor. | |
Table 1 Structural parameters of SrTiO3 (ST), Sr0.8Li0.2Ti0.8Nb0.2O3 (SL), Sr0.68Eu0.12Li0.2Ti0.8Nb0.2O3 (SL1c) and Sr0.74Eu0.12Li0.2Ti0.74Nb0.2O3 (SL2c)
| Sample |
STO |
SL |
SL1c |
SL2c |
| a (Å) |
3.9036(2) |
3.9115(1) |
3.9021(1) |
3.9159(1) |
| V (Å3) |
59.48 |
59.78 |
59.41 |
60.05 |
| Rp (%) |
13.18 |
11.29 |
13.76 |
12.19 |
| Rwp (%) |
15.16 |
12.89 |
15.86 |
15.21 |
| χ2 (%) |
1.9 |
1.6 |
1.6 |
1.5 |
| Sr–O (Å) |
2.7600(1) |
2.7660(1) |
2.7590(2) |
2.7690(2) |
| Ti–O (Å) |
1.9520(1) |
1.9550(1) |
1.9510(2) |
1.9580(2) |
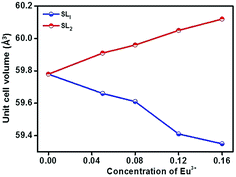 |
| | Fig. 3 Variation of unit cell volume for Sr0.8−xLi0.2Ti0.8Nb0.2O3:xEu3+ (SL1) and Sr0.8−x/2Li0.2Ti0.8−x/2Nb0.2O3:xEu3+ (SL2) as a function of concentration of Eu3+. | |
Fig. 4 shows IR transmittance spectra of the samples SrTiO3 (ST), Sr0.8Li0.2Ti0.8Nb0.2O3 (SL), Sr0.68Eu0.12Li0.2Ti0.8Nb0.2O3 (SL1c) and Sr0.74Eu0.12Li0.2Ti0.74Nb0.2O3 (SL2c). Normally observed Ti–O bands in perovskite titanates are in the 200–400 and 540–750 cm−1 regions.23 The broad band in the region 540–750 cm−1 corresponds to stretching mode (TO4) of Ti–O band.24,25 The IR active Nb–O antisymmetric stretching mode at 550 cm−1 and the finger print absorption of LiNbO3 near 677 cm−1 are superimposed with the Ti–O band.26,27 For SL2c, SL1c and SL, the absorption at 550 cm−1 is clearly visible in the spectra. No impurity peaks are observed in the spectra.
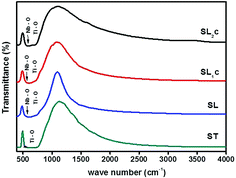 |
| | Fig. 4 FTIR transmittance spectra of SrTiO3 (ST), Sr0.8Li0.2Ti0.8Nb0.2O3 (SL), Sr0.68Eu0.12Li0.2Ti0.8Nb0.2O3 (SL1c) and Sr0.74Eu0.12Li0.2Ti0.74Nb0.2O3 (SL2c). | |
Raman spectroscopic analysis is used to determine substitution positions of europium ions in the samples. Raman spectra of Sr0.8−xLi0.2Ti0.8Nb0.2O3:xEu3+ [SL1, A-site substituted] and Sr0.8−x/2Li0.2Ti0.8−x/2Nb0.2O3:xEu3+ [SL2, A- and B-sites simultaneously substituted] samples are shown in Fig. S2(a) and (b)† respectively. Fig. 5 shows the Raman spectra of SL2c, SL1c, SL and ST. The irreducible representation of optical phonon modes of cubic perovskite with O1h(m3m) space group is
where F
1u species are allowed in infrared (IR) only and F
2u is forbidden in IR and Raman. Therefore no first order Raman scattering is expected, according to factor group symmetry analysis.
28,29 The presence of first order Raman modes along with the second order broad bands at 210–560 and 600–900 cm
−1 regions of pure ST sample evidences the breakdown of symmetry selection rules.
30–32 To preserve electro neutrality, creation of oxygen vacancies and distortion of structure occurs, when Eu
3+ ions are incorporated in the crystal system. Presence of impurity atoms and oxygen vacancies in the system may relax the first order symmetry principles and make the fundamental phonon modes, Slater-type (TO
1/LO
1), last-type (TO
2/LO
2) and axe-type (TO
4/LO
4) to appear.
32 In ABO
3, B ion motion against oxygen vibrations give rise to lowest frequency TO
1/LO
1 modes. Vibrations of A ions result in TO
2/LO
2 mid frequency modes. High frequency TO
4/LO
4 modes are due to oxygen vibrations in BO
6 octahedra.
33 Polar nature of these modes is responsible for their broadness in the Raman spectra.
34
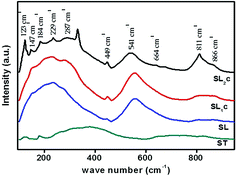 |
| | Fig. 5 Raman spectra of SrTiO3 (ST), Sr0.8Li0.2Ti0.8Nb0.2O3 (SL), Sr0.68Eu0.12Li0.2Ti0.8Nb0.2O3 (SL1c) and Sr0.74Eu0.12Li0.2Ti0.74Nb0.2O3 (SL2c) phosphors. | |
Here substitution of Eu3+ ions and the change of substitution positions alter the frequency and the intensity of observed Raman modes. Variation of intensity and frequency of Raman modes and appearance of new modes due to substitution of Eu3+ at A- and simultaneously at both A- and B-sites are studied by de-convolution of the observed Raman spectra (Fig. 6). Raman modes other than second order modes observed for the four samples, SrTiO3 (ST), Sr0.8Li0.2Ti0.8Nb0.2O3 (SL), Sr0.68Eu0.12Li0.2Ti0.8Nb0.2O3 (SL1c) and Sr0.74Eu0.12Li0.2Ti0.74Nb0.2O3 (SL2c) are represented in the Table 2. For SrTiO3, fundamental type first order modes are observed at 122 (TO1), 180 (TO2), 562 (TO4), and 758 cm−1 (LO4) and a mode due to tetragonal distortion at 151 cm−1.29,32,35 For Sr0.8Li0.2Ti0.8Nb0.2O3, corresponding modes are observed at 120 (TO1), 189 (TO2), 551 (TO4) and 807 cm−1 (LO4). The observed increase in intensity of Raman shift due to TO2 mode arises from incorporation of Li+ at A-sites, affecting vibrations of Sr2+ ions. The additional mode appeared at 447 cm−1 is from the first order vibrations of R-point of the Brillouin zone, which can be due to tetragonal distortion.36 This distortion in the frame work, resulted from the tilting of TiO6 octahedra on the addition of Li and Nb, deviates the tolerance factor of crystal structure from unity. Additional band at 267 (A1 (TO1)) and 876 cm−1 (E (LO)) are the first order bending modes of Nb–O–Nb linkage and the stretching vibrations of Nb–O bond respectively.29,37 A1 (TO1) and E (LO) are the active modes of LiNbO3 (R3c space group), which optical phonon modes are expressed by irreducible representation as,
| | |
Γoptical = 4A1 + 5A2 + 9E
| (2) |
where
A2 modes are Raman inactive.
38,39 In the case of SL
1c, augmentation of intensities of modes at 449 and 813 cm
−1 is a clear indication of enhanced local distortions in the lattice due to Eu incorporation at the A-sites.
22 For SL
2c, increased intensity of mode at 123 cm
−1 (TO
1) specifies incorporation of Eu
3+ at B-(Ti
4+) sites. This mode is related to Ti–O–Ti bending. Here the octahedral tilting occurred as a result of the substitution of larger Eu
3+ at smaller B-sites alter Ti–O–Ti vibrations to arise first order TO
1 mode. Intensity enhancement of first order TO
2, TO
4 and LO
4 modes at 184 and 541 and 811 cm
−1 respectively and first order
R-point vibrations at 147, 229 and 449 cm
−1, is an indication of increase of defect concentration, due to doping at B-sites.
22 The new band at 487 cm
−1, assigned as the LO
2 mode can be attributed to vibrations of Sr
2+.
33 Difference combinations and additive combinations contribute to new modes at 332 and 664 cm
−1 respectively.
22,29 Intensity enhancement of Ti–O vibration mode (LO
4) in pure strontium titanate suggests presence of impurities or oxygen vacancies at B-site according to earlier reports.
28 In order to find change in intensity of LO
4 mode at 811 cm
−1 with respect to doping, ratio of intensities (
ILO4/
I600) is calculated between that of LO
4 mode and the second order mode at 600 cm
−1, which is having significant intensity and no shift in position. Remarkable increase in the intensity ratio
ILO4/
I600 (
Table 2) for double site Eu doped phosphor further evidences increased polar defects created by incorporation of larger Eu
3+ ions instead of smaller Ti
4+ ions of different valance at the B-site in addition to the substitution at A-site.
40 In earlier reports, even though tetragonal local distortion was confirmed by vibrational spectroscopy, no evidence of tetragonal phase was confirmed by XRD analysis for the samples heavily doped with rare earth elements.
13,32 This is in agreement with the results obtained in our work.
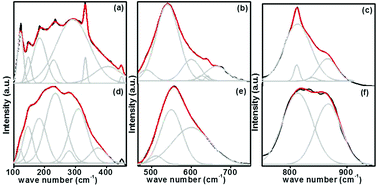 |
| | Fig. 6 Deconvoluted Raman spectra of Sr0.74Eu0.12Li0.2Ti0.74Nb0.2O3 (SL2c) in the range 100–460 (a), 460–750 (b), 750–950 cm−1 (c) and that of Sr0.68Eu0.12Li0.2Ti0.8Nb0.2O3 (SL1c) in the range 100–460 (d), 460–750 (e), 750–950 cm−1 (f). | |
Table 2 Raman shifts obtained from Raman spectra of SrTiO3 (ST), Sr0.8Li0.2Ti0.8Nb0.2O3 (SL), Sr0.68Eu0.12Li0.2Ti0.8Nb0.2O3 (SL1c) and Sr0.74Eu0.12Li0.2Ti0.74Nb0.2O3 (SL2c)
| Sample |
TO1 (cm−1) |
TO2 (cm−1) |
LO2 (cm−1) |
TO4 (cm−1) |
LO4 (cm−1) |
Nb–O modes (cm−1) |
R-Point modes (cm−1) |
ILO4/I600 |
| ST |
124 |
180 |
— |
562 |
758 |
— |
151 |
— |
| SL |
120 |
189 |
— |
551 |
807 |
277, 865 |
143, 447 |
0.44 |
| SL1 |
120 |
182 |
— |
550 |
813 |
235, 280, 867 |
146, 449 |
0.46 |
| SL2 |
123 |
184 |
487 |
541 |
811 |
235, 287, 866 |
147, 229, 449 |
2.01 |
To understand elemental composition and distribution of each element in the phosphors, EDX analysis of Sr0.8−xEuxLi0.2Ti0.8Nb0.2O3 (SL1c) and Sr0.74Eu0.12Li0.2Ti0.74Nb0.2O3 (SL2c) were done and found to be composed of elements Sr, Ti, Nb, Eu and O. Corresponding EDX spectra are shown in Fig. 7. Quantitative EDX analysis shows increase of concentration of Sr and decrease of concentration of Ti in SL2c in comparison with SL1c, while other elements remain almost unaltered, in accordance with the theoretical stoichiometry (Table 3). This demonstrates that in SL1c, Eu3+ ions are substituted at Sr2+ sites whereas in SL2c, the substitution of Eu3+ takes place both at Sr2+ and Ti4+ sites simultaneously and supports the fact that Nb5+ sites are almost undisturbed in the phosphor systems. Elemental X-ray dot mapping images show that constituent elements are equally distributed in the samples (Fig. 8).
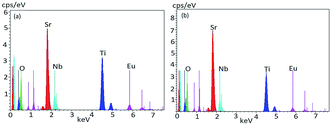 |
| | Fig. 7 EDX spectra of (a) Sr0.68Eu0.12Li0.2Ti0.8Nb0.2O3 (SL1c) and (b) Sr0.74Eu0.12Li0.2Ti0.74Nb0.2O3 (SL2c) phosphors. | |
Table 3 Quantitative EDX analysis data of Sr0.68Eu0.12Li0.2Ti0.8Nb0.2O3 (SL1c) and Sr0.74Eu0.12Li0.2Ti0.74Nb0.2O3 (SL2c) phosphors
| Element |
SL1c: Sr0.68Eu0.12Li0.2Ti0.8Nb0.2O3 |
SL2c: Sr0.74Eu0.12Li0.2Ti0.74Nb0.2O3 |
| Wt% |
At% |
Wt% |
At% |
| Sr L |
29.72 |
11.51 |
33.89 |
12.88 |
| O K |
32.04 |
67.94 |
33.61 |
69.95 |
| Ti K |
22.75 |
16.12 |
19.14 |
13.31 |
| Nb L |
6.86 |
2.50 |
6.71 |
2.41 |
| Eu L |
8.62 |
1.92 |
6.65 |
1.46 |
 |
| | Fig. 8 Elemental X-ray dot mapping images of (a) SL1c: Sr0.68Eu0.12Li0.2Ti0.8Nb0.2O3 and (b) SL2c: Sr0.74Eu0.12Li0.2Ti0.74Nb0.2O3 phosphors. | |
The TEM images and the SAED pattern of SL2c phosphor is shown in Fig. 9. The images show the crystalline nature of the phosphor and the obtained lattice spacing of 0.28 nm is in agreement the X-ray diffraction analysis.
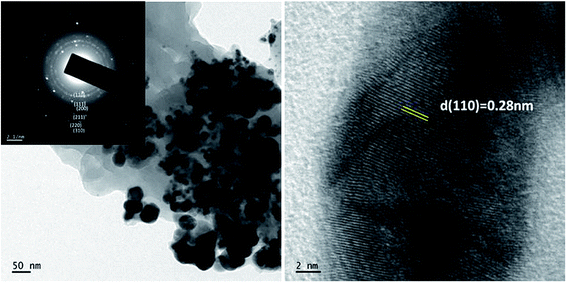 |
| | Fig. 9 The TEM images of Sr0.74Eu0.12Li0.2Ti0.74Nb0.2O3 (SL2c) and inset shows SAED image. | |
The diffuse reflectance spectra of SrTiO3 (ST), Sr0.8Li0.2Ti0.8Nb0.2O3 (SL), Sr0.68Eu0.12Li0.2Ti0.8Nb0.2O3 (SL1c) and Sr0.74Eu0.12Li0.2Ti0.74Nb0.2O3 (SL2c) show a broad band in the UV-visible region, 220–450 nm with maximum absorbance at 350 nm, which can be attributed to the charge transfer transition from the oxygen ligand to the central titanium, europium and niobium in metal oxygen octahedra (Fig. S3†). In addition to the charge transfer band, small peaks at 465 and 525 nm observed in the spectra of SL1c and SL2c are due to the intra 4f transition of Eu3+ ion. Kubelka–Munk method was used to calculate band gap energy of samples from diffuse reflectance spectra.41 Kubelka–Munk function F(Rα) is related to Rα as
| |
 | (3) |
where
Rα =
Rsample/
Rreference,
K is the absorption coefficient and
S, the scattering coefficient. Tauc equation relates band gap
Eg and linear absorption coefficient
α as
| |
 | (4) |
where
ν is the frequency of photon,
C1 is the proportionality constant and for direct allowed transitions,
n = 1. When there is perfect diffuse scattering,
K = 2
α and considering
S as a constant over the wavelength of measurement, from the above two equations, we can write,
| | |
[F(Rα)hν]2 = C2[hν − Eg]
| (5) |
From [F(Rα)hν]2 versus hν plot, energy gap was found out by extrapolating linear fitted portion of the curve to [F(Rα)hν]2 = 0 (Fig. S3†). The band gap energy of SL1 and SL2 type phosphors are demonstrated in the Table S2.† The obtained values of band gap are comparable with the reported value for SrTiO3.42
The photoluminescence excitation spectra of Sr0.8−xLi0.2Ti0.8Nb0.2O3:xEu3+ [SL1, A-site substituted] and Sr0.8−x/2Li0.2Ti0.8−x/2Nb0.2O3:xEu3+ [SL2, A- and B-sites simultaneously substituted] solid solutions with x varying from 0.05 to 0.16 are shown in Fig. S4 ((a) and (b) respectively)† and the normalized curves of samples with optimum Eu3+ concentration is shown in Fig. 10. In all these spectra, a broad charge transfer band (CTB) is present in the region from 350 to 445 nm. The sharp peaks in the spectra at 382, 395, 418, 465, 538 and 590 nm are due to the intra f–f transitions 7F0 → 6G2–4, 5L7, 7F0 → 5L6, 7F0 → 5D3, 7F0 → 5D2, 7F0 → 5D1 and 7F0 → 5D0 respectively of Eu3+ ions.43 The CTB is a combined effect of electronic transition from 2p orbital of O2− ions to central metal ions in metal–oxygen polyhedra. The position of CTB depends on covalence between O2− ion and central metal ion, oxygen–metal bond length and coordination number of metal ion.44 The band for O2p → Eu4f and O2p → Nb4d charge transfer transitions usually lie in the regions 250–300 and 250–310 nm.4,43 The observed CTB with low intensity in the region 350 to 450 nm is in agreement with the other reports on SrTiO3:Eu based phosphors.11,45 Similarly, for CaTiO3:Eu phosphor systems also a low intense CTB was observed in the region 370–410 nm, overlapped with f–f transitions.46,47 In complex hosts, the contributions from more than one component in the CTB cannot be resolved due to spectral overlap.48 The absence of O2−–Eu3+ CTB may be due to the possible overlap of charge transfer transition O2p → Eu4f with O2p → Ti3d and O2p → Nb4d. The attraction of europium ions towards electron clouds of oxygen ions and the resulting polarisation of europium octahedral will be different for different host matrices. Weak attraction between Eu3+ ions and electron clouds of oxygen ions decreases the probability of mixing of f-orbitals of Eu3+ and p orbitals of O2− and the occurrence of high intense CT transition.49 The enhanced f–f transitions at 382 and 418 nm in the excitation spectra of SL2 samples, when compared with SL1, signify the influence of substitution sites of Eu3+ (Fig. 7). For all samples the most intense absorption is at 465 nm and the other prominent absorption peak in the spectra is at 395 nm. The relative intensity of absorption at 465 nm increases with europium concentration, compared to the absorption at 395 nm. The photoluminescence spectra of SL1 and SL2 type phosphors under these wavelengths are shown in Fig. S5 and S6† respectively.
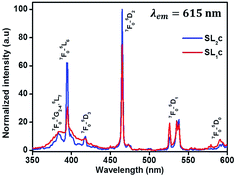 |
| | Fig. 10 Excitation spectra of samples with optimum Eu3+ concentration of SL1 type (SL1c) and SL2 type (SL2c) phosphors monitored at 615 nm, normalized with respect to the highest intensity of SL2c. | |
Emission from a lanthanide ion occurs due to magnetic dipole transition and electric dipole transition and the probability of transitions is determined by the symmetry of crystal lattice. All the emission spectra obtained in this investigation show mainly two peaks at 593 and 615 nm. However, the substitution of Eu3+ at Sr2+ sites and simultaneously at Sr2+ and Ti4+ sites makes the hyper sensitive electric dipole transition 5D0 → 7F2 observed at 615 nm to dominate over the 5D0 → 7F1 magnetic dipole transition at 593 nm. The variation of site symmetry of Eu3+ ions can be determined from the evolution of integrated emission intensity ratio of (5D0 → 7F2) to (5D0 → 7F1) transition, the asymmetric ratio R21. High value of asymmetry ratio (Table 4) indicates the occupancy of Eu3+ ions in non-centro symmetric sites.50 Larger the asymmetric ratio, closer is the optimal value of color chromaticity. Asymmetric ratio calculated for SL1 and SL2 phosphors indicates that there is reduction in the symmetry with the simultaneous substitution of Eu3+ at A- and B-sites. The presence of multiplets in the emission spectra of SL1 type phosphors, corresponding to 5D0 → 7F4 (681, 692 and 704 nm) transition are attributed to the partial lifting of degeneracy at the level J = 4 due to 2J + 1 Stark splitting.
Table 4 Asymmetric ratio (R21) calculated from emission spectra for Sr0.95−xEu0.05LixTi1−xNbxO3, Sr0.8−xLi0.2Ti0.8Nb0.2O3:xEu3+ (SL1) and Sr0.8−x/2Li0.2Ti0.8−x/2Nb0.2O3:xEu3+ (SL2) phosphors at 465 nm excitation
| Value of x |
Asymmetric ratio (R21) |
Value of x |
Asymmetric ratio (R21) |
| Sr0.95−xEu0.05LixTi1−xNbxO3 |
SL1 |
SL2 |
| 0 |
1 |
0.08 |
2.03 |
3.89 |
| 0.1 |
1.36 |
0.12 |
2.09 |
4.09 |
| 0.2 |
1.58 |
0.16 |
2.05 |
3.92 |
| 0.3 |
1.56 |
— |
— |
— |
The luminescence properties are strongly affected by the host lattice environment of Eu3+ activators. Intensive investigations on the influence of substitution of LNO in STO at various compositions and with varying concentrations of Eu3+ have been conducted initially. The doping concentration of Eu3+ in SrTiO3 is optimized as 5 mol% in earlier reports.11 Thus the typical photoluminescence of 5 mol% Eu3+ doped STO with LNO varying from 0 to 30 mol% is studied to optimize LNO concentration in samples and the corresponding emission spectra are shown in the Fig. S7.† The luminescence intensity increases as the concentration of LNO varies from x = 0 to 0.2, and then decreases. This is accompanied by the enhancement asymmetric ratio from 1 to 1.58 as shown in Table 4. The reasons for enhancement in PL properties due to LNO substitution is explained as follows. It has already been reported that for SrTiO3:xEu phosphor, emission due to magnetic dipole transition and electric dipole transition have almost comparable intensity, and is in agreement with that obtained in our work.11,51 This clearly manifests the change in local coordination around europium ions when perovskite Sr1−xEuxTiO3 is substituted with Li+ and Nb5+. The incorporation of Li+ and Nb5+ ions in the sites of Sr2+ and Ti4+ ions having different ionic radii and valance may prompt a structural adjustment in such a way as to enhance luminescence properties up to 20 mol% of LNO concentration. Here the substitution of LNO does not create quenching defects due to charge imbalance since the excess charge created by Li+ substitution is compensated by Nb5+ ions. Also, the low phonon nature of LNO may enhance the radiative properties in the system. The departure from cubic symmetry, as confirmed from XRD analysis may result in the luminescence quenching in the system when concentration of LNO exceeds 20 mol%. The PL spectra of SL1 and SL2 type phosphors prepared with europium content, x = 0.12 (SL1c and SL2c respectively) for which the luminescence emission intensity was maximum, along with the spectrum of Sr0.95Eu0.05TiO3 is shown in Fig. 11. This figure evidences the interesting feature of this work, viz., increase in the intensity of red emission and the asymmetric ratio of electric dipole transition 5D0 → 7F2 to magnetic dipole transition 5D0 → 7F1 as a consequence of substitution of Eu3+ at A sites and simultaneously at A and B sites in Sr0.8Li0.2Ti0.8Nb0.2O3 when compared with that of strontium titanate.
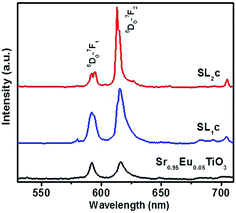 |
| | Fig. 11 Comparison of emission spectra of Sr0.95Eu0.05TiO3, Sr0.68Eu0.12Li0.2Ti0.8Nb0.2O3 (SL1c) and Sr0.74Eu0.12Li0.2Ti0.74Nb0.2O3 (SL2c). | |
Comparison of emission from SL2c and SL1c phosphors under 465 nm excitation is presented in the Fig. 12(a). The red emission peak becomes sharper and more intense with a change of peak wavelength from 615 to 613 nm as the substitution of Eu3+ is done at both A- and B-sites instead of at A-sites alone. Here the intensity enhances 1.46 times and FWHM decreases from 7.34 to 3.99 nm. A similar behavior of both increase of intensity of red emission and color purity can be observed for emissions under 395 nm excitation also (Fig. 12(b)). The enhancement of luminescence properties for the samples in which Eu3+ ions are substituted simultaneously both at A- and B-sites can be attributed to the following factors. The substitution of larger Eu3+ ions for smaller Ti4+ ions results in increased defect concentration at the B-sites in SL2 type phosphors leading to the local tetragonal distortion due to octahedral tilting, as evidenced by Raman spectra. This increase in local asymmetry favors the enhancement of luminescence properties. Achieving a balance between the number of Sr2+ and Ti4+ sites replaced by Eu3+ ions can lead to a state of valance compensation. This charge compensation in the crystal system is of prime importance in the enhancement of luminescence from phosphors.52,53 A splitting of 5D0 → 7F1 and 5D0 → 7F2 emission lines into two is observed for SL2 phosphors (Fig. 12 and S6†). This suggests the presence of two nonequivalent crystallographic Eu3+ sites in these samples since it was not observed for samples with Eu3+ substituted exclusively at A-sites.54
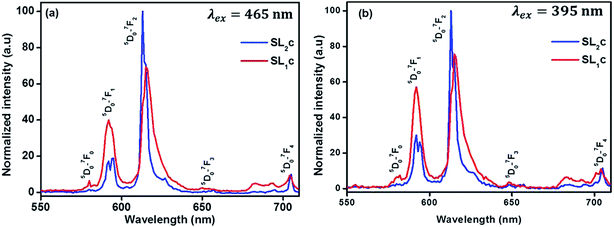 |
| | Fig. 12 Emission spectra of Sr0.68Eu0.12Li0.2Ti0.8Nb0.2O3 (SL1c) and Sr0.74Eu0.12Li0.2Ti0.74Nb0.2O3 (SL2c) under the excitation of (a) 465 nm and (b) 395 nm, normalized with respect to the highest intensity of SL2c. | |
Initially we have carried out a detailed investigation into the luminescence properties of Sr0.8Li0.2Ti0.8Nb0.2O3:Eu with varying degree of Eu3+ substitution at Sr and Ti sites. The emission spectra of the phosphors, under 465 nm excitation with Eu3+ at Sr2+ and Ti4+ sites in the ratio 1![[thin space (1/6-em)]](https://www.rsc.org/images/entities/char_2009.gif) :
:![[thin space (1/6-em)]](https://www.rsc.org/images/entities/char_2009.gif) 0, 0.8
0, 0.8![[thin space (1/6-em)]](https://www.rsc.org/images/entities/char_2009.gif) :
:![[thin space (1/6-em)]](https://www.rsc.org/images/entities/char_2009.gif) 0.2, 0.67
0.2, 0.67![[thin space (1/6-em)]](https://www.rsc.org/images/entities/char_2009.gif) :
:![[thin space (1/6-em)]](https://www.rsc.org/images/entities/char_2009.gif) 0.33 and 1
0.33 and 1![[thin space (1/6-em)]](https://www.rsc.org/images/entities/char_2009.gif) :
:![[thin space (1/6-em)]](https://www.rsc.org/images/entities/char_2009.gif) 1 is shown in Fig. S8† and it indicates that the optimum doping ratio is 1
1 is shown in Fig. S8† and it indicates that the optimum doping ratio is 1![[thin space (1/6-em)]](https://www.rsc.org/images/entities/char_2009.gif) :
:![[thin space (1/6-em)]](https://www.rsc.org/images/entities/char_2009.gif) 1. It has already been reported that perovskite materials exhibit a limit for B-site doping.22 In this work, it is found that doping of Eu3+ at Ti sites beyond 50% results in formation of additional phases of Eu3Ti2O7 and SrCO3. Hence, for obtaining single phase red phosphors, we have limited occupancy ratio of Eu3+ to 1
1. It has already been reported that perovskite materials exhibit a limit for B-site doping.22 In this work, it is found that doping of Eu3+ at Ti sites beyond 50% results in formation of additional phases of Eu3Ti2O7 and SrCO3. Hence, for obtaining single phase red phosphors, we have limited occupancy ratio of Eu3+ to 1![[thin space (1/6-em)]](https://www.rsc.org/images/entities/char_2009.gif) :
:![[thin space (1/6-em)]](https://www.rsc.org/images/entities/char_2009.gif) 1.
1.
Photoluminescence emission intensity enhances nearly 6 times as the concentration of Eu ions in the prepared SL1 type phosphors increases from 5 mol% to 12 mol%, as shown in the Fig. S5,† beyond which it decreases. A similar trend is observed for SL2 type phosphors (Fig. S6†). This quenching of luminescence is observed because of the cross-relaxation mechanism between Eu3+ ions. The rate of non radiative energy transfer is high in systems with high dopant concentration. In cross relaxation mechanism, a fraction of excitation energy absorbed by an activator is transferred to another identical ion. As the concentration of the activators increases, the effective distance between them decreases. According to Blasse,55 the critical distance between dopant ions for energy transfer can be calculated as
| |
 | (6) |
where
V is the volume of unit cell,
xc is the critical ion concentration and
N is the number of Z ions in the unit cell. In the case of SL
1 type phosphors, the estimated value of
Rc is 17.74 Å, for which
V = 58.43 Å
3,
xc = 0.02 and
N = 1. The estimated value of
Rc for SL
2 is 18.06 Å. Generally there are three mechanisms for non-radiative energy transfer namely, radiation reabsorption, exchange interaction and electrostatic multipolar interaction. For radiation reabsorption to occur fluorescence and absorption spectra should overlap and it is not possible in this case. The Eu
3+ ions must be very close to each other
i.e.; a distance of separation of 6 Å or less is needed for the exchange interaction to take place.
1 The values for
Rc obtained here rejects the chance of overlap of donor and acceptor ion charge distribution. As a result we can infer that the electrostatic multipolar interaction is the major mechanism which brings about the concentration quenching in this case.
Energy level diagram of all possible transitions considering excitation and emission spectra is presented in the Fig. 13. The color coordinates (x, y), correlated color temperature and color purity calculated from the emission spectra under 465 nm excitation for the phosphors are depicted in the Table 5. The chromaticity coordinates calculated using CIE 1931 color matching functions56 indicate that all the phosphors have red emission. The CIE 1931 chromaticity diagram and correlated color temperature diagram of the prepared SL1 and SL2 samples with optimum Eu3+ concentration, under 465 nm excitation is shown in the Fig. 14 ((a) and (b) respectively). Correlated color temperature in kelvin scale, a unique property of solid state lighting devices, is used to characterize emitted light. CCT is calculated from color coordinates (x, y) using McCamy method57 as
| | |
CCT = −449n3 + 3525n2 − 6823.3n + 5520.33
| (7) |
where
n = (
x −
xe)/(
y −
ye). Here (
xe,
ye), found as (0.3320, 0.1858), is the epicenter of convergence of isotemperature lines in 1931 CIE chromaticity diagram and
n is the reciprocal of slope of line connecting (
x,
y) and (
xe,
ye). Color purity of luminescence of the phosphors is determined using
| |
 | (8) |
where (
xi,
yi) and (
xd,
yd) are the chromaticity coordinates of white illuminant (0.333, 0.333) and of dominant wavelength in the emission respectively.
58 Considering samples with optimum Eu
3+ concentration, color purity of emission enhances from 89% to 94.7% when the substitution site of Eu
3+ changes from single to double.
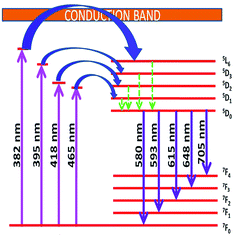 |
| | Fig. 13 Schematic energy level diagram showing possible transitions of Eu3+ activator ion in the host matrix. | |
Table 5 Color coordinates, correlated color temperature and color purity calculated from emission spectra under 465 nm excitation for Sr0.8−xEuxLi0.2Ti0.8Nb0.2O3 (SL1) and Sr0.8−x/2EuxLi0.2Ti0.8−x/2Nb0.2O3 (SL2) phosphors
| Value of x |
SL1: Sr0.8−xEuxLi0.2Ti0.8Nb0.2O3 |
SL2: Sr0.8−x/2EuxLi0.2Ti0.8−x/2Nb0.2O3 |
| Color coordinates |
CCT (kelvin) |
Color purity (%) |
Color coordinates |
CCT (kelvin) |
Color purity (%) |
| x |
y |
x |
y |
| 0.08 |
0.64 |
0.36 |
1994 |
88.6 |
0.65 |
0.35 |
2266 |
92.2 |
| 0.12 |
0.64 |
0.36 |
1994 |
89.0 |
0.66 |
0.34 |
2634 |
94.7 |
| 0.16 |
0.64 |
0.36 |
1994 |
89.0 |
0.66 |
0.34 |
2634 |
94.5 |
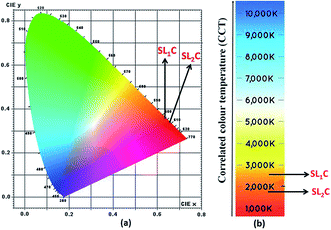 |
| | Fig. 14 (a) CIE chromaticity diagram and (b) correlated color temperature diagram of Sr0.68Eu0.12Li0.2Ti0.8Nb0.2O3 (SL1c) and Sr0.74Eu0.12Li0.2Ti0.74Nb0.2O3 (SL2c). | |
Photoluminescence life time measurements demonstrate the dynamics of down conversion in Eu3+ ions. The photoluminescence decay curves for 5D0 → 7F2 transition (615 nm) of the prepared SL1 and SL2 phosphors under 465 nm excitation is shown in the Fig. S9 ((a) and (b) respectively).† Decay curves of phosphors with optimum Eu3+ concentration, SL1c and SL2c, fitted with exponential functions are given in Fig. 15. All the transients of SL1 are fitted well with the single exponential decay function as,
| |
 | (9) |
where
I,
I0 and
τ are intensity at time
t, intensity at time zero and decay time respectively and
A is a constant. The fitting parameters of PL decay curves of SL
1 phosphors are represented in
Table 6. The single exponential nature of decay curves of these A-site doped phosphors indicates the presence of single activator site in the host matrix.
1 The lifetime of
5D
0 excited state is determined by radiative and non-radiative decay rates. Phosphor which has least non-radiative energy transfer shows longest life time.
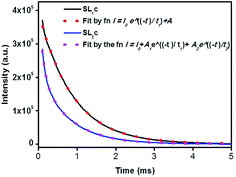 |
| | Fig. 15 The photoluminescence decay curves for 5D0 → 7F2 transition (615 nm) of Sr0.68Eu0.12Li0.2Ti0.8Nb0.2O3 (SL1c) and Sr0.74Eu0.12Li0.2Ti0.74Nb0.2O3 (SL2c) under 465 nm excitation, fitted by single and double exponential functions respectively. | |
Table 6 The fitting parameters of PL decay curves of Sr0.8−xEuxLi0.2Ti0.8Nb0.2O3 (SL1)
| Value of x |
τ (ms) |
I0 |
A |
| 0.08 |
0.826(1) |
314(9) |
53![[thin space (1/6-em)]](https://www.rsc.org/images/entities/char_2009.gif) 789(12) 789(12) |
| 0.12 |
0.875(1) |
492(7) |
395![[thin space (1/6-em)]](https://www.rsc.org/images/entities/char_2009.gif) 720(23) 720(23) |
| 0.16 |
0.841(1) |
283(8) |
70![[thin space (1/6-em)]](https://www.rsc.org/images/entities/char_2009.gif) 804(15) 804(15) |
However luminescence decay curves of Sr0.8−x/2EuxLi0.2Ti0.8−x/2Nb0.2O3 (SL2) phosphors shown in the Fig. S9(b)† are fitted well with the double exponential function,
| |
 | (10) |
where
τ1 and
τ2 are the life time values of activator ions occupying two sites of dissimilar crystallographic environments and
A1 and
A2 are constants.
1,15 The average decay time can be calculated as
| |
 | (11) |
The relative ratio factor is calculated as
| |
 | (12) |
The fitting parameters are shown in Table 7. The presence of two life time values indicates the existence of two types of Eu3+ activator ions. According to phonon frequency concept, for optimum doping concentration, 45% of total population occupying relatively higher symmetric site of Sr2+ are long lived species with life time 0.765 ms. The other 55% of Eu3+ ions, short lived species with life time 0.092 ms resides at the lower symmetric site of Ti4+.6,59,60 It is found that as the concentration of europium in the samples increases, the population of long lived species decreases. While looking at the values of life time reported, one should take into account the fact that the life time of Eu3+ ions at different sites of Sr2+ and Ti4+ ions will be different and which in turn can make the average life time depending on the responsible number of host sites at which substitution was made.
Table 7 The fitting parameters of PL decay curves of Sr0.8−x/2EuxLi0.2Ti0.8−x/2Nb0.2O3 (SL2)
| Value of x |
τ1 (ms) |
τ2 (ms) |
τav (ms) |
A1 |
A2 |
R1 |
R2 |
I0 |
| 0.08 |
0.765(1) |
0.130(1) |
0.708 |
25![[thin space (1/6-em)]](https://www.rsc.org/images/entities/char_2009.gif) 957(12) 957(12) |
14![[thin space (1/6-em)]](https://www.rsc.org/images/entities/char_2009.gif) 960(10) 960(10) |
0.63 |
0.37 |
127(8) |
| 0.12 |
0.765(1) |
0.092(1) |
0.680 |
216![[thin space (1/6-em)]](https://www.rsc.org/images/entities/char_2009.gif) 709(25) 709(25) |
260![[thin space (1/6-em)]](https://www.rsc.org/images/entities/char_2009.gif) 628(32) 628(32) |
0.45 |
0.55 |
385(7) |
| 0.16 |
0.720(1) |
0.123(1) |
0.604 |
37![[thin space (1/6-em)]](https://www.rsc.org/images/entities/char_2009.gif) 755(10) 755(10) |
53![[thin space (1/6-em)]](https://www.rsc.org/images/entities/char_2009.gif) 063(10) 063(10) |
0.42 |
0.58 |
154(4) |
3.2 Judd–Ofelt and radiative analysis
For assessing radiative properties, luminescence behavior and site symmetry of Eu3+ ions in SL1 and SL2 type phosphors, Judd–Ofelt intensity parameters were calculated for representative compositions. Judd–Ofelt theory50,61 is used to determine the phenomenological parameters Ωλ (λ = 2, 4, 6) by fitting experimental line strength data. The values of Judd–Ofelt intensity parameters are dependent on the lanthanide ion and largely independent on the host matrix producing the crystal field surrounding the ion. These values are important in systematizing lanthanide intensity data. The differences in the values of Ωλ for a given lanthanide ion in different hosts can be attributed to differential ligand field effects associated with coordination numbers, coordination geometries and lanthanide–ligand interaction mechanisms.62 They are important for investigating the local structure and bonding in the host where the rare earth ions are situated. Ω2 is the most sensitive parameter to the local structure and the material composition, which determine the asymmetry and covalence of lanthanide ion.63 But Ω4 and Ω6 parameters depend on bulk material properties like viscosity and dielectric constant. Usually Ω2, Ω4 and Ω6 are determined from a least square fit to the experimental absorption intensities. Since the reduced matrix elements (RME), U(2), U(4) and U(6) are non-zero only for the 5D0 → 7F2, 5D0 → 7F4, 5D0 → 7F6 transitions respectively, J–O parameters of Eu3+ ion can be calculated from the observed transition rates with taking the magnetic dipole transition 5D0 → 7F1 as the reference. This technique, first proposed by Krupke64 using absorption spectrum is very useful to calculate J–O parameters in various hosts. But here we adopted the same method with a difference of calculating the parameters using the spontaneous decay rates and calculation procedure is shown in ESI.†65 The values of Ω6 could not be calculated, since 5D0–7F6 emission was lower than minimum detection limit of spectrofluorometer used. The J–O parameters were then used to calculate the transition probabilities Aj′–j of excited states. From these quantities, the radiative life time τr, branching ratio β0J, luminescence quantum efficiency η and stimulated emission cross section σ0J were found and listed in the table.
According to Judd–Ofelt theory, the spontaneous radiative decay rate Ar, corresponding to the electronic transition in Eu3+ ions from an excited state 5D0 to the final state 7FJ can be calculated using,
| |
 | (13) |
where
ν is the wave number associated with the transition,
h the Planck constant,
χ the local field correction for the effective field induced by the host lattice and
S the line strength of the electronic transition involved.
66 The spontaneous radiative decay rate has a cubic dependence with the energy gap between the levels
5D
0 and
7F
J. The larger the frequency of emitting radiation, larger will be the radiative emission rate. For electric dipole (ED) transitions,
| |
 | (14) |
| |
 | (15) |
where
λ = 2, 4, 6 and for magnetic dipole transitions,
| | |
SMD = μB2|〈5D0||U(λ)||7FJ〉|2
| (17) |
where
n, the average refractive index was obtained as 2.21 and 2.17 for SL
1 and SL
2 samples respectively from reflection ellipsometry techniques.
μB is the Bohr magneton and |〈
5D
0||
U(λ)||
7F
J〉|
2 are the reduced matrix elements (RME) of irreducible tensor operator of rank
λ. Physically
Uλ stands for electron repulsion and spin orbit coupling. The values of RME are host independent and have been reported by Carnall
et al.67,68 for various lanthanide ions. The electric dipole transitions within the 4f shell of a rare earth ion are possible only if its nucleus is not situated at the center of inversion. J–O parameter
Ω2 is very sensitive to the asymmetric neighborhood of Eu
3+ ions.
Ω2 is found to increase with increase in concentration of Eu
3+ in the prepared phosphors for both SL
1 and SL
2 samples with the latter has a large value in all the cases (
Table 8). This indicates that the degree of increase in local asymmetry in the lattice with Eu concentration is at different rates for SL
1 and SL
2 type samples. The increase of value of
Ω2 from 3.67 × 10
−20 cm
2 for A-site substituted sample to 4.80 × 10
−20 cm
2 for A- and B-site substituted sample (for optimum doping concentration) is a direct evidence of increased local asymmetry in the system due to A- and B-sites substitution of Eu. This is also substantiated by Raman analysis. From the calculated values, we can find that
Ω2 >
Ω4. This shows the covalent nature of bonding between Eu
3+ and host matrix.
58 The radiative life time
τr of the emitting state
5D
0 is related to the spontaneous emission probabilities for all transitions from this state to the low lying
7F
J states,
| |
 | (18) |
Table 8 Judd–Ofelt intensity parameters (Ω2, Ω4) of Sr0.8−xEuxLi0.2Ti0.8Nb0.2O3 (SL1) and Sr0.8−x/2EuxLi0.2Ti0.8−x/2Nb0.2O3 (SL2) samples
| Parameter |
Sr0.8−xEuxLi0.2Ti0.8Nb0.2O3 |
Sr0.8−x/2EuxLi0.2Ti0.8−x/2Nb0.2O3 |
| x = 0.08 |
x = 0.12 |
x = 0.16 |
x = 0.08 |
x = 0.12 |
x = 0.16 |
| Ω2 (10−20 cm2) |
3.60 |
3.67 |
3.39 |
4.58 |
4.80 |
4.78 |
| Ω4 (10−20 cm2) |
1.59 |
1.63 |
1.69 |
1.64 |
0.75 |
0.61 |
The observed luminescence life time of the state 5D0 is
| |
 | (19) |
Quantum efficiency is the ratio of number of photons emitted to number of photons absorbed by the system and is given by,
| |
 | (20) |
In estimating quantum efficiency, for Sr0.8−xEuxLi0.2Ti0.8Nb0.2O3, single value of life time, τ alone is to be taken into account but for Sr0.8−x/2EuxLi0.2Ti0.8−x/2Nb0.2O3, τ1 and τ2 are to be considered and the observed changes in quantum yield are attributed to population of ions at different sites A- and B- and the respective lifetimes. The fluorescence branching ratio which gives the relative contribution of each transition from the excited state to a final state can be determined as
| |
 | (21) |
where
J = 1, 2, 4. The highest branching ratio is found for
5D
0 →
7F
2 emission, as this is the dominant emission line, responsible for red color. The peak stimulated emission cross section for the transition
5D
0 →
7F
J is related to the radiative transition probability as
| |
 | (22) |
where
λp is the peak wave length of emission transition and Δ
λeff is the effective line width of the emission band. The highest stimulated emission cross section obtained for
5D
0 →
7F
2 emission indicating that it is the most efficient transition. The calculated J–O parameters and radiative parameters (
Table 9) are at par with the reported values for Eu
3+ ions.
10,49,50,56
Table 9 Transition rates (AR, ANR and AT), life time (τrad and τobs), emission quantum efficiency (η), branching ratios (β01, β02, β04) and stimulated emission cross sections (σ01, σ02 and σ04) of Sr0.8−xEuxLi0.2Ti0.8Nb0.2O3 and Sr0.8−x/2EuxLi0.2Ti0.8−x/2Nb0.2O3 phosphors
| Radiative parameter |
Sr0.8−xEuxLi0.2Ti0.8Nb0.2O3 |
Sr0.8−x/2EuxLi0.2Ti0.8−x/2Nb0.2O3 |
| x = 0.08 |
x = 0.12 |
x = 0.16 |
x = 0.08 |
x = 0.12 |
x = 0.16 |
| AR (s−1) |
707 |
717 |
712 |
867 |
943 |
930 |
| ANR (s−1) |
503 |
425.5 |
475.9 |
542.8 |
527.8 |
622 |
| AT (s−1) |
1210 |
1140 |
1180 |
1410 |
1470 |
1650 |
| τrad (ms) |
1.41 |
1.39 |
1.40 |
1.15 |
1.06 |
1.08 |
| τobs (ms) |
0.826 |
0.875 |
0.841 |
0.708 |
0.680 |
0.604 |
| η (%) |
58.9 |
62.9 |
60.1 |
61.6 |
64.2 |
55.9 |
| β01 (%) |
23.2 |
22.8 |
23.0 |
20.6 |
18.6 |
19.5 |
| β02 (%) |
62.1 |
62.2 |
58.0 |
74.1 |
76.2 |
76.4 |
| β04 (%) |
13.1 |
13.2 |
13.8 |
3.28 |
4.31 |
2.70 |
| σ01 (10−23 cm2) |
20.7 |
19.8 |
19.6 |
27.8 |
35.6 |
37 |
| σ02 (10−22 cm2) |
7.93 |
8.02 |
8.09 |
7.67 |
8.19 |
7.2 |
| σ04 (10−23 cm2) |
3.4 |
3.71 |
3.55 |
3.71 |
2.96 |
1.92 |
4. Conclusions
In summary, this work proposes a new series of SrTiO3:LiNbO3 perovskite solid solution host lattices to derive ample Eu3+ luminescence, under both UV (395 nm) and blue (465 nm) irradiations. Three series of red emitting phosphors Sr0.95−xEu0.05LixTi1−xNbxO3, Sr0.8−xLi0.2Ti0.8Nb0.2O3:xEu3+ and Sr0.8−x/2Li0.2Ti0.8−x/2Nb0.2O3:xEu3+ were prepared using conventional high temperature solid state reaction. The photoluminescence intensity and asymmetric ratio of 5D0 → 7F2 to 5D0 → 7F1 transitions of SrTiO3:Eu3+ phosphor were highly sensitive to LiNbO3 incorporation. In this work an attempt was made to understand the effect of Eu3+ substitution at A-sites (Sr2+) and at A- and B-sites (Sr2+ and Ti4+) simultaneously. High resolution transmission electron micrographs showed the crystalline nature of the samples and elemental X-ray dot mapping images confirmed the homogeneous distribution of constituent elements in the phosphor samples. The site selective substitution was analyzed using techniques such as X-ray diffraction, Raman spectroscopy and luminescence life time measurements. We found that when the substitution was made simultaneously at A- and B-sites to produce Sr0.8−x/2Li0.2Ti0.8−x/2Nb0.2O3:xEu3+, the color purity was found to increase from 89 to 94.7% along with the enhancement in intensity of red emission by 1.46 times with respect to that of A site substituted Sr0.8−xLi0.2Ti0.8Nb0.2O3:xEu3+. The change in unit cell volume obtained from Rietveld refinement of X-ray diffraction patterns and the increase in intensity of first order TO2, TO4 and LO4 vibrational modes and the first order R-point vibrations in the Raman shifts confirmed the site selected substitutions of Eu3+ ions. The double exponential luminescence decay curves of Sr0.8−x/2Li0.2Ti0.8−x/2Nb0.2O3:xEu3+ and the existence of slow decaying Eu3+ ions having 0.765 ms life time with 45% occupancy and fast decaying Eu3+ ions having 0.092 ms life time with 55% occupancy (for optimum dopant concentration) also clearly evidenced the simultaneous substitution at A- and B-sites. The critical distance between dopant ions for energy transfer was found to be 17.74 and 18.06 Å for A-sites doped and A- and B-sites doped phosphors respectively. Increase in asymmetric ratio was observed due to decrease in local symmetry around Eu3+ ions, and this observation was in good agreement with the increase in value of the intensity parameter Ω2 obtained from Judd–Ofelt analysis. The results indicate that Sr0.8−xLi0.2Ti0.8Nb0.2O3:xEu3+ can act as a promising red phosphor in a variety of applications by exciting either at 395 or at 465 nm. In addition, the proposed site selective substitution can further improve its color purity and intensity.
Acknowledgements
G. Jyothi acknowledges University Grants Commission (UGC), India for the award of teacher fellowship under faculty development programme. The authors acknowledge Dr P. Prabhakar Rao, Chief Scientist and Head, Materials Science Division, CSIR-National Institute for Interdisciplinary Studies and Technology, Thiruvananthapuram, India for his valuable help in performing Rietveld analysis.
References
- K. Li, X. Liu, Y. Zhang, X. Li, H. Lian and J. Lin, Inorg. Chem., 2015, 54, 323–333 CrossRef CAS PubMed.
- E. Downing, L. Hesselink, J. Ralston and R. Macfarlane, Science, 1996, 273, 1185–1189 CAS.
- S.-P. Lee, S.-D. Liu, T.-S. Chan and T.-M. Chen, ACS Appl. Mater. Interfaces, 2016, 8, 9218–9223 CAS.
- S. K. Mahesh, P. P. Rao, M. Thomas, T. L. Francis and P. Koshy, Inorg. Chem., 2013, 52, 13304–13313 CrossRef CAS PubMed.
- S. Saha, S. Das, U. K. Ghorai, N. Mazumder, D. Ganguly and K. K. Chattopadhyay, J. Phys. Chem. C, 2015, 119, 16824–16835 CAS.
- S. K. Gupta, a. K. Yadav, D. Bhattacharya, S. N. Jha and V. Natarajan, J. Lumin., 2015, 164, 1–22 CrossRef CAS.
- Q. Zhang, H. Sun, T. Kuang, R. Xing and X. Hao, RSC Adv., 2015, 5, 4707–4715 RSC.
- J. Boltersdorf, B. Zoellner, C. M. Fancher, J. L. Jones and P. A. Maggard, J. Phys. Chem. C, 2016, 120, 19175–19188 CAS.
- M. Sletnes, M. Lindgren, J. C. Valmalette, N. P. Wagner, T. Grande and M. A. Einarsrud, J. Solid State Chem., 2016, 237, 72–80 CrossRef CAS.
- R. Shukla, S. K. Gupta, V. Grover, V. Natarajan and A. K. Tyagi, Dalton Trans., 2015, 44, 10628–10635 RSC.
- C. Jiang, L. Fang, M. Shen, F. Zheng and X. Wu, Appl. Phys. Lett., 2009, 94, 2007–2010 Search PubMed.
- H. Zhan, Z.-G. Chen, J. Zhuang, X. Yang, Q. Wu, X. Jiang, C. Liang, M. Wu and J. Zou, J. Phys. Chem. C, 2015, 119, 3530–3537 CAS.
- A. Durán, E. Martínez, J. A. Díaz and J. M. Siqueiros, J. Appl. Phys., 2005, 97, 104109 CrossRef.
- A. Tkach, P. M. Vilarinho, D. Nuzhnyy and J. Petzelt, Acta Mater., 2010, 58, 577–582 CrossRef CAS.
- F. Kang, M. Peng, X. Yang, G. Dong, G. Nie, W. Liang, S. Xu and J. Qiu, J. Mater. Chem. C, 2014, 2, 6068 RSC.
- D. Wang, T. Kako and J. Ye, J. Phys. Chem. C, 2009, 113, 3785–3792 CAS.
- L. Tsonev, Opt. Mater., 2008, 30, 892–899 CrossRef CAS.
- L. Xing, Y. Xu, R. Wang, W. Xu, S. Gu and X. Wu, Chem. Phys. Lett., 2013, 577, 53–57 CrossRef CAS.
- E. P. Smirnova, A. V. Sotnikov, N. V. Za, M. Weihnacht and V. V. Lemanov, Phys. Solid State, 2008, 50, 122–125 CrossRef CAS.
- Y. Tsur, T. D. Dunbar and C. A. Randall, J. Electroceram., 2001, 7, 25–34 CrossRef CAS.
- J. Shi, J. Ye, L. Ma, S. Ouyang, D. Jing and L. Guo, Chem.–Eur. J., 2012, 18, 7543–7551 CrossRef CAS PubMed.
- Y. G. Abreu, J. C. Soares, R. L. Moreira and A. Dias, J. Phys. Chem. C, 2016, 120, 16960–16968 CAS.
- P. R. Arya, P. Jha and A. K. Ganguli, J. Mater. Chem., 2003, 13, 415–423 RSC.
- J. Y. Dai, W. P. Chen, G. K. H. Pang, P. F. Lee, H. K. Lam, W. B. Wu, H. L. W. Chan and C. L. Choy, Appl. Phys. Lett., 2003, 82, 3296 CrossRef CAS.
- W. Luo, Z. Li, X. Jiang, T. Yu, L. Liu, X. Chen and Z. Zou, Phys. Chem. Chem. Phys., 2008, 3, 6717–6723 RSC.
- G. Bhaskar Kumar and S. Buddhudu, Phys. B, 2008, 403, 4164–4170 CrossRef CAS.
- W. Li, L. Ning and P. A. Tanner, J. Phys. Chem. A, 2012, 116, 7337–7344 CrossRef CAS PubMed.
- U. Balachandran and N. G. Eror, J. Am. Ceram. Soc., 1982, 65, c54–c56 CrossRef CAS.
- S. Qin, X. Wu, F. Seifert and A. I. Becerro, J. Chem. Soc., Dalton Trans., 2002, 3751–3755 RSC.
- A. Grzechnik, G. H. Wolf and P. F. McMillan, J. Raman Spectrosc., 1997, 28, 885–889 CrossRef CAS.
- F. A. Rabuffetti, H.-S. Kim, J. A. Enterkin, Y. Wang, C. H. Lanier, L. D. Marks, K. R. Poeppelmeier and P. C. Stair, Chem. Mater., 2008, 20, 5628–5635 CrossRef CAS.
- R. L. Moreira, R. P. S. M. Lobo, G. Subodh, M. T. Sebastian, F. M. Matinaga and A. Dias, Chem. Mater., 2007, 19, 6548–6554 CrossRef CAS.
- J. Hlinka, J. Petzelt, S. Kamba, D. Noujni and T. Ostapchuk, Phase Transitions, 2006, 79, 41–78 CrossRef CAS.
- M. D. Fontana, G. Metrat, J. L. Servoin and F. Gervais, J. Phys. C: Solid State Phys., 1984, 17, 483–514 CrossRef CAS.
- A. E. Souza, G. T. A. Santos, B. C. Barra, W. D. Macedo, S. R. Teixeira, C. M. Santos, A. M. O. R. Senos, L. Amaral and E. Longo, Cryst. Growth Des., 2012, 12, 5671–5679 CAS.
- P. Jayabal, V. Sasirekha, J. Mayandi, K. Jeganathan and V. Ramakrishnan, J. Alloys Compd., 2014, 586, 456–461 CrossRef CAS.
- D. Hreniak, A. Speghini, M. Bettinelli and W. Strek, J. Lumin., 2006, 119, 219–223 CrossRef.
- M. N. Iliev, M. L. F. Philips, J. K. Meen and T. M. Nenoff, J. Phys. Chem. B, 2003, 107, 14261–14264 CrossRef CAS.
- M. P. F. Graça, M. A. Valente, M. Peres, A. Cruz, M. J. Soares, A. J. Neves, T. Monteiro, L. C. Alves and E. Alves, J. Phys.: Condens. Matter, 2007, 19, 16213 CrossRef.
- A. Slodczyk, M.-H. Limage, P. Colomban, O. Zaafrani, F. Grasset, J. Loricourt and B. Sala, J. Raman Spectrosc., 2011, 42, 2089–2099 CrossRef CAS.
- S. Som, P. Mitra, V. Kumar, V. Kumar, J. J. Terblans, H. C. Swart and S. K. Sharma, Dalton Trans., 2014, 43, 9860 RSC.
- E. Orhan, F. M. Pontes, M. A. Santos, E. R. Leite, A. Beltrán, J. Andrés, T. M. Boschi, P. S. Pizani, J. A. Varela, A. Carlton, A. Taft and E. Longo, J. Phys. Chem. B, 2004, 108, 9221–9227 CrossRef CAS.
- G. Blasse and B. C. Grabmaier, Luminescent Materials, Springer Berlin Heidelberg, Berlin, Heidelberg, 1994 Search PubMed.
- A. Ling Li and S. Zhang, J. Phys. Chem. B, 2006, 110, 21438–21443 CrossRef PubMed.
- C. R. García, J. Oliva, M. T. Romero, R. Ochoa-Valiente and L. A. G. Trujillo, Adv. Mater. Sci. Eng., 2015, 2015, 1–7 CrossRef.
- Y. F. Wu, Y. T. Nien, Y. J. Wang and I. G. Chen, J. Am. Ceram. Soc., 2012, 95, 1360–1366 CrossRef CAS.
- P. J. Zeng, L. P. Yu, Z. X. Qiu, J. L. Zhang, C. Y. Rong, C. Z. Li, Z. H. Fu and S. X. Lian, J. Sol-Gel Sci. Technol., 2012, 64, 315–323 CrossRef CAS.
- Y. Su, L. Li and G. Li, Chem. Mater., 2008, 20, 6060–6067 CrossRef CAS.
- G. Blasse, Spectra and Chemical Interactions, Springer Berlin Heidelberg, Berlin, Heidelberg, 1976, pp. 43–79 Search PubMed.
- B. R. Judd, Phys. Rev., 1962, 127, 750–761 CrossRef CAS.
- B. Marí, K. C. Singh, P. Cembrero-Coca, I. Singh, D. Singh and S. Chand, Displays, 2013, 34, 346–351 CrossRef.
- J. Liu, H. Lian and C. Shi, Opt. Mater., 2007, 29, 1591–1594 CrossRef CAS.
- W. Ran, L. Wang, L. Tan, D. Qu and J. Shi, Sci. Rep., 2016, 6, 27657 CrossRef CAS PubMed.
- H. J. S. Fuping Du, Y. Nakai, T. Tsuboi and Y. Huang, J. Mater. Chem., 2011, 4669–4678 Search PubMed.
- G. Blasse, Philips Res. Rep., 1969, 24, 131–144 CAS.
- R. W. G. Hunt, Measuring Colour: Applied Science and Industrial Technology, Ellis Horwood, New York, 2nd edn, 1991 Search PubMed.
- C. S. McCamy, Color Res. Appl., 1992, 17, 142–144 CrossRef.
- R. G. A. Kumar, S. Hata, K. Ikeda and K. G. Gopchandran, RSC Adv., 2016, 6, 67295–67307 RSC.
- S. K. Gupta, C. Reghukumar and R. M. Kadam, RSC Adv., 2016, 6, 53614–53624 RSC.
- S. K. Gupta, P. S. Ghosh, N. Pathak, a. Arya and V. Natarajan, RSC Adv., 2014, 4, 29202 RSC.
- G. S. Ofelt, J. Chem. Phys., 1962, 37, 511 CrossRef CAS.
- E. M. Stephens, S. Davis, M. F. Reid and F. S. Richardson, Inorg. Chem., 1984, 23, 4607–4611 CrossRef CAS.
- Ä. Andresen, A.-N. Bahar, D. Conradi, I.-I. Oprea, R. Pankrath, U. Voelker, K. Betzler, M. Wöhlecke, U. Caldiño, E. Martín, D. Jaque and J. G. Solé, Phys. Rev. B: Condens. Matter Mater. Phys., 2008, 77, 214102 CrossRef.
- W. F. Krupke, Phys. Rev., 1966, 145, 325–337 CrossRef CAS.
- L. Liqin and C. Xueyuan, Nanotechnology, 2007, 18, 255704 CrossRef.
- M. J. Weber, T. E. Varitimos and B. H. Matsinger, Phys. Rev. B: Solid State, 1973, 8, 47–53 CrossRef CAS.
- W. T. Carnall, H. Crosswhite and H. M. Crosswhite, Argonne Natl. Lab. Report, Argonne, IL, USA, 1978 Search PubMed.
- W. T. Carnall, P. R. Fields and K. Rajnak, J. Chem. Phys., 1968, 49, 4450 CrossRef CAS.
Footnote |
| † Electronic supplementary information (ESI) available: Calculation procedure for Judd–Ofelt intensity parameters. Fig. S1, (a) XRD patterns and (b) expanded view of (110) reflection of Sr0.95−xEu0.05LixTi1−xNbxO3 phosphors. Fig. S2, Raman spectra of (a) SL1:Sr0.8−xLi0.2Ti0.8Nb0.2O3:xEu3+ and (b) SL2: Sr0.8−x/2Li0.2Ti0.8−x/2Nb0.2O3:xEu3+. The DR spectra and inset: [F(Rα)hν]2 versus band gap plots in Fig. S3. Fig. S4 shows excitation spectra of different samples monitored at 615 nm (a) SL1: Sr0.8−xLi0.2Ti0.8Nb0.2O3:xEu3+ and (b) SL2: Sr0.8−x/2Li0.2Ti0.8−x/2Nb0.2O3:xEu3+. Fig. S5 shows emission spectra of SL1:Sr0.8−xLi0.2Ti0.8Nb0.2O3:xEu3+ phosphors under (a) 465 nm and (b) 395 nm excitations. Fig. S6 shows emission spectra of SL2: Sr0.8−x/2Li0.2Ti0.8−x/2Nb0.2O3:xEu3+ phosphors under (a) 465 nm and (b) 395 nm excitations; insets, the expanded view of 5D0 → 7F1 and 5D0 → 7F2 transitions for the respective excitations. Fig. S7, emission spectra of Sr0.95−xEu0.05LixTi1−xNbxO3 phosphors under 465 nm excitation. Fig. S8, emission spectra of Sr0.8Li0.2Ti0.8Nb0.2O3:Eu3+ phosphors in which Eu3+ substituted at Sr and Ti sites at different doping ratio, under 465 nm excitation. The photoluminescence decay curves for 5D0–7F2 transition (615 nm) of Sr0.8−xEuxLi0.2Ti0.8Nb0.2O3 (SL1) and Sr0.8−x/2EuxLi0.2Ti0.8−x/2Nb0.2O3 (SL2) phosphors under 465 nm excitation in Fig. S9(a) and (b) respectively. Structural parameters and band gap energy of Sr0.8−xLi0.2Ti0.8Nb0.2O3:xEu3+ (SL1) and Sr0.8−x/2Li0.2Ti0.8−x/2Nb0.2O3:xEu3+ (SL2) phosphors are presented in Tables S1 and S2. See DOI: 10.1039/c7ra03598e |
|
| This journal is © The Royal Society of Chemistry 2017 |
 Open Access Article
 *a
*a

![[thin space (1/6-em)]](https://www.rsc.org/images/entities/char_2009.gif) :
:![[thin space (1/6-em)]](https://www.rsc.org/images/entities/char_2009.gif) 0 for SL1 and 1
0 for SL1 and 1![[thin space (1/6-em)]](https://www.rsc.org/images/entities/char_2009.gif) :
:![[thin space (1/6-em)]](https://www.rsc.org/images/entities/char_2009.gif) 1 for SL2 phosphors at Sr2+ and Ti4+ sites. In the case of SL1, the lattice parameter (a) reduces from 3.9115(1) to 3.9006(1) and cell volume contracts about 0.72% and for SL2, the lattice parameter increases from 3.9115(1) to 3.9175(1) and unit cell volume expands about 0.57% when europium content is increased from 0 to 16 mol% (Fig. 3). These changes in the cell volume are reflected in the Sr–O and Ti–O bond distances. Considering the ionic radii of Sr2+ ions (1.44 Å, CN 12) and Li+ ions (0.92 Å, CN 8) positioned at the A-sites and Ti4+ ions (0.605 Å, CN 6) and Nb5+ ions (0.640 Å, CN 6) at B-sites, contraction of unit cell observed for SL1 proposes the possibility of entering Eu3+ ions (0.947 Å, CN 6) in A-site replacing Sr2+ ions.11,21,22 In the case of SL2, the observed expansion of cell volume is a clear indication of occupancy of Eu3+ ions at the sites of smaller Ti4+ ions (B-sites) in addition to the most favorable A-site occupancy.11,19,20 The substitution of Eu3+ ions at Nb5+ sites is excluded here by considering the fact that concentration of Nb5+ is only 4 times less than that of titanium and strontium in these systems.
1 for SL2 phosphors at Sr2+ and Ti4+ sites. In the case of SL1, the lattice parameter (a) reduces from 3.9115(1) to 3.9006(1) and cell volume contracts about 0.72% and for SL2, the lattice parameter increases from 3.9115(1) to 3.9175(1) and unit cell volume expands about 0.57% when europium content is increased from 0 to 16 mol% (Fig. 3). These changes in the cell volume are reflected in the Sr–O and Ti–O bond distances. Considering the ionic radii of Sr2+ ions (1.44 Å, CN 12) and Li+ ions (0.92 Å, CN 8) positioned at the A-sites and Ti4+ ions (0.605 Å, CN 6) and Nb5+ ions (0.640 Å, CN 6) at B-sites, contraction of unit cell observed for SL1 proposes the possibility of entering Eu3+ ions (0.947 Å, CN 6) in A-site replacing Sr2+ ions.11,21,22 In the case of SL2, the observed expansion of cell volume is a clear indication of occupancy of Eu3+ ions at the sites of smaller Ti4+ ions (B-sites) in addition to the most favorable A-site occupancy.11,19,20 The substitution of Eu3+ ions at Nb5+ sites is excluded here by considering the fact that concentration of Nb5+ is only 4 times less than that of titanium and strontium in these systems.


![[thin space (1/6-em)]](https://www.rsc.org/images/entities/char_2009.gif) :
:![[thin space (1/6-em)]](https://www.rsc.org/images/entities/char_2009.gif) 0, 0.8
0, 0.8![[thin space (1/6-em)]](https://www.rsc.org/images/entities/char_2009.gif) :
:![[thin space (1/6-em)]](https://www.rsc.org/images/entities/char_2009.gif) 0.2, 0.67
0.2, 0.67![[thin space (1/6-em)]](https://www.rsc.org/images/entities/char_2009.gif) :
:![[thin space (1/6-em)]](https://www.rsc.org/images/entities/char_2009.gif) 0.33 and 1
0.33 and 1![[thin space (1/6-em)]](https://www.rsc.org/images/entities/char_2009.gif) :
:![[thin space (1/6-em)]](https://www.rsc.org/images/entities/char_2009.gif) 1 is shown in Fig. S8† and it indicates that the optimum doping ratio is 1
1 is shown in Fig. S8† and it indicates that the optimum doping ratio is 1![[thin space (1/6-em)]](https://www.rsc.org/images/entities/char_2009.gif) :
:![[thin space (1/6-em)]](https://www.rsc.org/images/entities/char_2009.gif) 1. It has already been reported that perovskite materials exhibit a limit for B-site doping.22 In this work, it is found that doping of Eu3+ at Ti sites beyond 50% results in formation of additional phases of Eu3Ti2O7 and SrCO3. Hence, for obtaining single phase red phosphors, we have limited occupancy ratio of Eu3+ to 1
1. It has already been reported that perovskite materials exhibit a limit for B-site doping.22 In this work, it is found that doping of Eu3+ at Ti sites beyond 50% results in formation of additional phases of Eu3Ti2O7 and SrCO3. Hence, for obtaining single phase red phosphors, we have limited occupancy ratio of Eu3+ to 1![[thin space (1/6-em)]](https://www.rsc.org/images/entities/char_2009.gif) :
:![[thin space (1/6-em)]](https://www.rsc.org/images/entities/char_2009.gif) 1.
1.


![[thin space (1/6-em)]](https://www.rsc.org/images/entities/char_2009.gif) 789(12)
789(12)![[thin space (1/6-em)]](https://www.rsc.org/images/entities/char_2009.gif) 720(23)
720(23)![[thin space (1/6-em)]](https://www.rsc.org/images/entities/char_2009.gif) 804(15)
804(15)


![[thin space (1/6-em)]](https://www.rsc.org/images/entities/char_2009.gif) 957(12)
957(12)![[thin space (1/6-em)]](https://www.rsc.org/images/entities/char_2009.gif) 960(10)
960(10)![[thin space (1/6-em)]](https://www.rsc.org/images/entities/char_2009.gif) 709(25)
709(25)![[thin space (1/6-em)]](https://www.rsc.org/images/entities/char_2009.gif) 628(32)
628(32)![[thin space (1/6-em)]](https://www.rsc.org/images/entities/char_2009.gif) 755(10)
755(10)![[thin space (1/6-em)]](https://www.rsc.org/images/entities/char_2009.gif) 063(10)
063(10)


