Electronic and optical properties of new multifunctional materials via half-substituted hematite: first principles calculations
Hua
Yang
a,
Wenbo
Mi
*a,
Haili
Bai
a and
Yingchun
Cheng
b
aTianjin Key Laboratory of Low Dimensional Materials Physics and Preparing Technology, Institute of Advanced Materials Physics, Faculty of Science, Tianjin University, Tianjin, 300072, China. E-mail: miwenbo@tju.edu.cn
bPSE Division, KAUST, Thuwal, 23955-6900, Kingdom of Saudi Arabia
First published on 19th September 2012
Abstract
Electronic structure and optical properties of α-FeMO3 systems (M = Sc, Ti, V, Cr, Cu, Cd or In) have been investigated using first principles calculations. All of the FeMO3 systems have a large net magnetic moment. The ground state of pure α-Fe2O3 is an antiferromagnetic insulator. For M = Cu or Cd, the systems are half-metallic. Strong absorption in the visible region can be observed in the Cu and Cd-doped systems. Systems with M = Sc, Ti, V, Cr or In are not half-metallic and are insulators. The strongest peaks shift toward shorter wavelengths in the absorption spectra. It is concluded that transition metal doping can modify the electronic structure and optical properties of α-FeMO3 systems.
1. Introduction
Since the development of spintronics,1,2 much attention has been focused on controlling the motion of electrons by efficiently manipulating the spin. In spintronics, high-spin injection from ferromagnets with high spin polarization into a semiconductor is crucial for application at high temperatures, but half-metallic materials such as Fe3O4 and CrO2 (for example) and diluted magnetic semiconductors cannot yet be used in spintronic devices. Therefore, it is important to find new materials with high spin polarization. In general, magnetic elements have been doped into semiconductors to produce spin-polarized carriers. However, the following question remains: if nonmagnetic elements are doped into antiferromagnetic oxide insulators, can high-spin polarized carriers appear?Recent research on antiferromagnetic hematite (α-Fe2O3) has been stimulated by interest in photoelectrochemical (PEC) performance.3–7 The interest here is in materials that can be manufactured into spintronic devices and that can capture and store solar energy. This will require the development and engineering of multifunctional materials with excellent characteristics of magnetism, electronics and optics. To realize this goal, α-Fe2O3 is of interest because of its unique combination of good chemical stability under harsh conditions, low cost, photocatalytic stability, nontoxicity, environmental inertness and a band gap of 1.9–2.2 eV, which allows it to absorb a significant amount of the solar spectrum.8–11 In addition, α-Fe2O3 is also a very promising material in the fields of catalysts, pigments, magnetic materials, gas sensors, and lithium-ion batteries.12–14 Although α-Fe2O3 exhibits potentially good PEC performance, it does have the following drawbacks: a low absorption coefficient, poor conductivity, and high electron–hole recombination rate due to short hole diffusion length.15–17 A great number of experimental results have been reported on the PEC performance of α-Fe2O3 with dopants, such as Zn,18,19 Al,20 Ti and Si8,21–23etc. Transition metal doped α-Fe2O3 may be potentially applicable to spintronic and PEC applications and this warrants investigation of the spin-polarized characteristics and PEC performance of these materials.
In this paper, the electronic structure and optical properties of α-FeMO3 systems (M = Sc, Ti, V, Cr Cu, Cd and In) have been systematically investigated by using a local spin density approximation with Hubbard-U corrections (LSDA + U) based on density functional theory (DFT). The following two conclusions are gained: (1) When the impurities are introduced into α-Fe2O3, its band structure is modified. In particular, the conductivity of α-FeMO3 (M = Cu, Cd) is improved since we predict these materials to have half-metallic characteristics; this can lead to significantly enhanced photocurrents and light response. (2) The absorption coefficient is improved. For M = Cu and Cd, the absorption coefficient is noticeably enhanced in the visible range. In addition, the incorporation of Sc, Ti, V and Cr shifts the associated absorption spectra to the low-energy range and enhances the absorption coefficient.
2. Calculation details and model
All spin-polarized calculations in this work were performed with ultrasoft pseudopotentials (USPP) as implemented in the Cambridge Serial Total Energy Package (CASTEP) code,24 a plane wave DFT code. Exchange–correlation was treated using the local density approximation (LDA), as parameterized by the Ceperley and Alder-Pedew and Zunger (CA-PZ) functional and strong correlation effects were introduced by means of the LSDA + U scheme. Although the LDA method has some drawbacks, as mentioned in other DFT studies,25,26 for α-Fe2O3, LDA + U gives reasonable results, as shown in another study.5 The LDA + U method requires fewer computing resources compared to other approaches to strong correlation. The interactions between valence electrons and ion cores were represented by Vanderbilt-type USPP.27 The valence-electron configuration of O and Fe was chosen as 2s22p4, 3d64s2, respectively. A cutoff energy of 380 eV was used along with a 3 × 3 × 1 k-mesh according to the Monkhorst–Pack grid28 for Brillouin zone sampling. The density of states (DOS) were calculated with a 6 × 6 × 2 k-point mesh. The lattice parameters and the atomic coordinates were fully relaxed without any restrictions using the Broyden–Fletcher–Goldfarb–Shanno (BFGS) method.29 In the optimization process, the energy changes as well as maximum tolerances of the force, stress, and displacement were set as 5 × 10⁻⁶ eV atom−1, 0.01 eV Å−1, 0.02 GPa and 5 × 10⁻⁴ Å, respectively.Hematite has a band gap of 1.9–2.2 eV,30 which allows visible light absorption up to ∼600 nm. It is well known that pure α-Fe2O3 has a hexagonal corundum-type structure with a space group of R![[3 with combining macron]](https://www.rsc.org/images/entities/char_0033_0304.gif) c (167) at ambient conditions. The hexagonal unit cell has the lattice constants of a = b = 5.0356 Å, c = 13.7489 Å at room temperature,31 which contains six Fe2O3 formula units including 12 Fe atoms and 18 O atoms. Below the Néel temperature of 953 K, α-Fe2O3 is an antiferromagnetic (AFM) insulator.32,33 Each layer of Fe atoms is separated by a plane of O atoms. The intralayer coupling between the Fe atoms within the same layer is ferromagnetic, but the interlayer coupling between the adjacent Fe layers is AFM.34 The Fe centers are 3d5 with a distorted octahedral local environment that produces a high-spin crystal field splitting.35,36 The experimentally-measured magnetic moment of individual Fe atoms in α-Fe2O3 is 4.6–4.9 μB.37 However, the magnetic moment of each Fe atom is predicted to be 3.96 μB in this study. Compared with other theoretical calculations,36,38,39 our calculated magnetic moment of the individual Fe atoms is in close agreement. This give us confidence that the chosen k-points mesh is sufficient, and in order to compare the change of the properties after introducing M-atoms into the alpha-Fe2O3 lattice, the same k-mesh is applied. Convergence of the magnetic moments for the magnetic systems in this study with respect to k-mesh was not pursued; further details may be found in DFT studies of other magnetic compounds.40,41
c (167) at ambient conditions. The hexagonal unit cell has the lattice constants of a = b = 5.0356 Å, c = 13.7489 Å at room temperature,31 which contains six Fe2O3 formula units including 12 Fe atoms and 18 O atoms. Below the Néel temperature of 953 K, α-Fe2O3 is an antiferromagnetic (AFM) insulator.32,33 Each layer of Fe atoms is separated by a plane of O atoms. The intralayer coupling between the Fe atoms within the same layer is ferromagnetic, but the interlayer coupling between the adjacent Fe layers is AFM.34 The Fe centers are 3d5 with a distorted octahedral local environment that produces a high-spin crystal field splitting.35,36 The experimentally-measured magnetic moment of individual Fe atoms in α-Fe2O3 is 4.6–4.9 μB.37 However, the magnetic moment of each Fe atom is predicted to be 3.96 μB in this study. Compared with other theoretical calculations,36,38,39 our calculated magnetic moment of the individual Fe atoms is in close agreement. This give us confidence that the chosen k-points mesh is sufficient, and in order to compare the change of the properties after introducing M-atoms into the alpha-Fe2O3 lattice, the same k-mesh is applied. Convergence of the magnetic moments for the magnetic systems in this study with respect to k-mesh was not pursued; further details may be found in DFT studies of other magnetic compounds.40,41
In this study, we account for the strong correlation of Fe d bands, and the inadequate DFT description of the strong coulomb interaction between the 3d electrons localized on metal ions, using the LSDA + U approach (Dudarev DFT + U method)42,43 with U = 8 eV for the d bands of Fe and doped metal. For the Fe 3d states, U = 5–6 eV is appropriate for the Vienna ab initio simulation package (VASP). However, due to the difference between USPP (employed in the present study) and projector augmented wave (PAW) potentials in VASP: the larger value of U is required by CASTEP. As discussed in Shang et.al.,44 it is common practice to compute the U based upon some previously known property of the material. Following this, we find that the calculated bandgap and magnetic moment are in reasonable agreement with existing theoretical results when U = 8 eV is adopted.5,34,39 The calculated band gap of α-Fe2O3 is 2.19 eV, which is in close accord with the experiment value of 2.2 eV. The AFM ordering in α-Fe2O3 is important to obtain the ground state electronic structure, and it is recognized that the energy of the AFM ground state is lowest for α-Fe2O3.39 Therefore, we choose this ground state as our starting point. To simulate the layer-by-layer AFM order along the z-axis observed in α-Fe2O3, a hexagonal representation of the unit cell containing 12 Fe atoms and 18 O atoms is constructed to simulate the magnetic structure. For α-FeMO3 systems, all of the spin-up Fe atoms are substituted by transitional metal atoms, including Sc, Ti, V, Cr, Cu, Cd and In, which correspond to 50% substitution at the Fe sites, as shown in Fig. 1. The calculations on the partial substitutions of M for spin up and/or spin down Fe ions will be considered in future work, following the procedure detailed for XLi3N2 compounds.45 Following the structural optimization and total energy calculations, the formation energy (Ef) of the α-FeMO3 systems is defined as follows: Ef = Etot(α-FeMO3) − Etot(α-Fe2O3) + μ(Fe) − μ(M) where Etot(α-FeMO3) is total energy of an α-FeMO3 system, and Etot(α-Fe2O3) is total energy of pure α-Fe2O3. The chemical potentials of Fe and M atoms (M = Sc, Ti, V, Cr Cu, Cd and In) are μ(Fe) and μ(M), respectively. The chemical potentials of Fe and M are taken as the energy per atom in bulk metallic Fe and M, respectively. Thus, for all of the cases, the calculated negative formation energies Ef , listed in Table 1, indicate that all of the α-FeMO3 systems are thermodynamically stable based upon electronic energies.
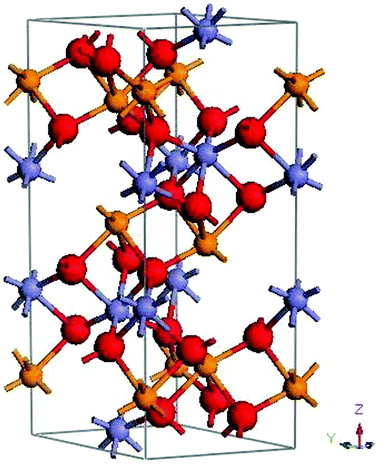 | ||
| Fig. 1 A hexagonal hematite unit cell with AFM ordering labeled by different colors at Fe sites. The grey-blue and orange spheres represent the spin-down and spin-up Fe atoms, respectively. The red spheres are oxygen atoms. All of the spin-up Fe atoms are substituted by metal impurities (M = Sc, Ti, V, Cr Cu, Cd and In). | ||
| System | pure | Sc | Ti | V | Cr | Cu | Cd | In |
|---|---|---|---|---|---|---|---|---|
| Total | 0 | −30 | −24 | −18 | −12 | −18 | −24 | −30 |
| Fe | ±3.96 | −4.2 | −3.79 | −4.04 | −4.1 | −3.72 | −3.68 | −4.16 |
| O | 0 | −0.24 | −0.002 | −0.34 | −0.4 | 0.12 | −0.08 | −0.26 |
| Dopant | — | −0.04 | −0.07 | 2.06 | 3.3 | 0.36 | −0.06 | −0.04 |
| E f | 0 | −4 | −3.33 | −0.18 | −1.03 | −1.37 | −3.5 | −6.47 |
Regarding the optical properties of interest in this study, the imaginary part ε2(w) and the real part ε1(w) of the complex dielectric function ε(w) = ε1(w) + iε2(w) were calculated based on DFT. The real part ε1 and imaginary part ε2 of the dielectric function follow from the Kramers–Kronig relationship.46,47 The spectra resulting from excitations can be thought of as a joint density of states (DOS) between the conduction and valence bands. The imaginary part (ε2(ω)) of the dielectric function can be written as
 | (1) |
 | (2) |
 | (3) |
 | (4) |
| L(w) = ε2(w)/[ε21(w) + ε22(w)] | (5) |
3. Results and discussions
3.1. Electronic structure
The calculated band structure, total density of states (TDOS) and partial density of states (PDOS) of pure α-Fe2O3 are shown in Fig. 2. From the band structure, the insulating nature of pure α-Fe2O3 is reproduced. The calculated band gap is about 2.19 eV, which is consistent with the experimental value of 2.2 eV obtained at room temperature8,15 as well as the value computed in another theoretical study.5 In addition, one can deduce from the symmetric TDOS and asymmetric PDOS of the spin-up Fe atoms that pure α-Fe2O3 is an antiferromagnetic insulator, which is consistent with other calculations, such as GGA + U5, and GGA-PW91.49 Also, from the asymmetry between the spin-up and the spin-down PDOS of the spin-up Fe atoms (shown in the bottom panel of Fig. 2), the calculated magnetic moment per Fe atom is 3.96 μB, which is smaller than the experimental value (4.6–4.9 μB) obtained at 77 K by neutron diffraction.37 The calculated magnetic moment per Fe atom calculated by using GGA is 3.4 μB.39 Simultaneously, the hybridization between the O-2p and Fe-3d states takes place over the whole band. It is also found from the DOS that the valence band mainly consists of the O-2p and Fe-3d states with a bandwidth of 11 eV. The lowest energy region of the valence band from −20.7 to −17.7 eV is from the occupied O-s states, and the upper valence band to the Fermi energy from −7 to 0 eV contains the occupied O-2p states and a minor presence of the occupied Fe-3d states. The region above the band gap mainly contains the unoccupied Fe-3d states and a contribution from the O-2p states. Thus, the valence band maximum (VBM) is mainly from the O-2p bands and the conduction band minimum (CBM) is mainly from the Fe-3d bands, which is consistent with experiments50,51 and theoretical results based upon the hybrid functional B3LYP,23 which show that pure α-Fe2O3 is a charge-transfer insulator.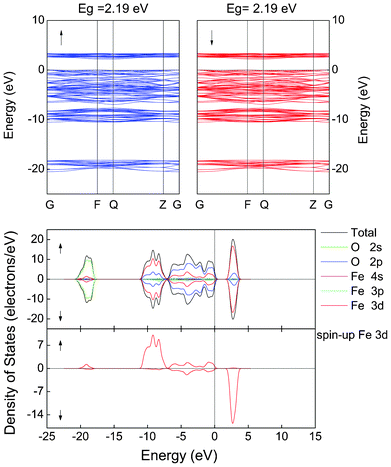 | ||
| Fig. 2 The calculated band structure, total and partial DOS of α-Fe2O3. The Fermi level is set to zero. Up/down arrows stand for the spin-up/spin-down channel. The 3d PDOS of the single spin-up Fe atom is given in the bottom figure. | ||
Substitution of Cu and Cd into α-Fe2O3 leads to a half-metallic band structure of these materials. Here, the spin-up channel is semiconducting and spin-down channel is metallic, as shown in Fig. 3(a) and (b) for the Cu- and Cd-containing materials, respectively. In both cases, the TDOS results clearly indicate that there is a value of DOS at the Fermi level in the spin-down channel whereas it is zero in the spin-up channel. Only the DOS of spin-down electrons passes through the Fermi level into the conduction bands, implying that the spin polarization of the conduction carriers is 100%. Due to the introduction of Cu and Cd, the symmetry of the crystal field surrounding each atom is broken, leading to split O-2p and Fe-3d levels into asymmetric states. From the PDOS, when Cu is added, Cu (3d104s1) donates one s and one d electron to the surrounding O atoms, leaving nine d electrons on the Cu site. Acceptor states are induced above the VBM of α-Fe2O3. The spin-down O-2p state extends toward higher energies. The O-2p states dominate the DOS near the Fermi level with a small contribution from Cu-3d and Fe-3d states. In the spin-down channel, the Cu-3d states overlap with the O-2p states at the Fermi level, suggesting that there is a hybridization between the Cu-3d and O-2p states. In the spin-up channel, Fe-3d and O-2p are responsible for the unoccupied states above the Fermi level. The bottom of the conduction band is mainly occupied by Fe-3d states and a minor amount of O-2p states. The topmost level of the valence band is mainly from spin-down O-2p states. For α-FeCdO3, similar results are gained despite the absence of acceptor states induced by Cd. However, for α-FeInO3, no half-metallic character is predicted, but the spin-down band gap is reduced to about 0.98 eV, which would be beneficial for the enhancement of the conductivity, as shown in Fig. 3(c). By introducing Cu and Cd into α-Fe2O3, the electrical conductivity is enhanced due to the half-metallic character, which is beneficial for hindering the recombination of the electron–hole pair and extending the life of carriers. The half-metallic characteristics make this system potentially useful in spintronic devices and suggest that attempts at synthesis are warranted.
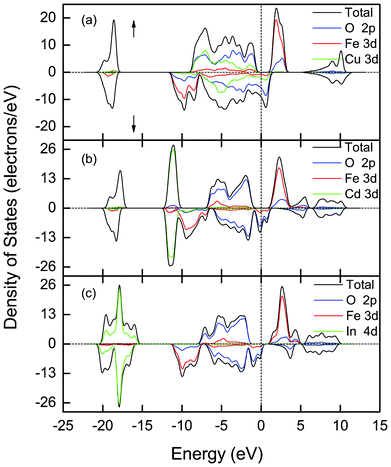 | ||
| Fig. 3 LSDA + U calculated total and partial DOS of α-FeMO3, M = (a) Cu, (b) Cd and (c) In. The Fermi level is set to zero. Up/down arrows stand for the spin-up/spin-down channel. | ||
The electronic structure of α-FeMO3 (M = Sc, Ti, V, Cr) is also calculated, as shown in Fig. 4. It is found that the results are different from the Cu and Cd-added cases. For the Sc, Ti, V, Cr-doped cases, the systems are predicted to be insulating in both the spin-up and spin-down channels. However, the TDOS and PDOS of the spin-up and spin-down channels are asymmetric. Therefore, all of the cases are ferromagnetic. The magnetic moments of the unit cell and individual atoms of the α-FeMO3 systems (M = Sc, Ti, V, Cr) systems have been given in Table 1. It is clear that the maximum moment is from α-FeScO3, and the minimum moment is from α-FeCrO3.
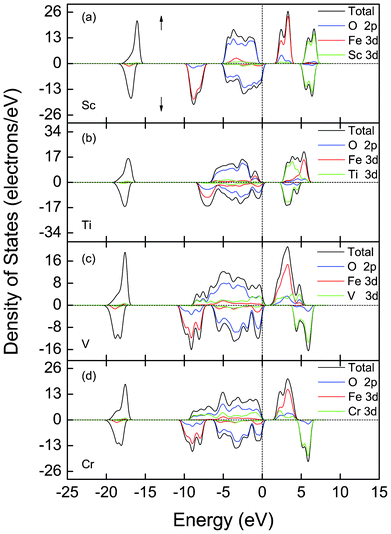 | ||
| Fig. 4 Total and partial DOS of α-FeMO3, M = (a) Sc, (b) Ti, (c) V and (d) Cr. Herewith, U is 8 eV. The Fermi level is set to zero. Up/downs arrow stand for the spin-up/spin-down channel. | ||
The calculated DOS of α-FeScO3 is depicted in Fig. 4(a). A Sc3+ ion at a Fe3+ site loses its three valence electrons, which forms a closed shell electronic d0 configuration. Thus, Sc3+ ions are theoretically predicted to have no net magnetic moment, while the replaced Fe atom has a formal Fe3+ ionization state with a nominal local magnetic moment of 5 μB. In fact, a single Sc3+ ion has a small magnetic moment of −0.04 μB and each Fe3+ ion has a magnetic moment of −4.2 μB from our calculations. The net magnetic moment of the system is −30 μB, opposite to that of the spin-up substituted Fe atom. The band gaps are 2.3 eV and 4.85 eV for the spin-up and spin-down channels, respectively. The CBM of α-FeScO3 has almost no change and the Fe-3d state still dominates. The Sc-3d states are positioned at higher energies. This suggests that the heavy effective mass for electrons remains unchanged and Sc substituted into α-Fe2O3 will not enhance the initial electronic conductivity.
For α-FeTiO3, the calculated DOS is shown in Fig. 4(b). We find that Ti (3d24s2) loses its four valence electrons, yielding a Ti4+ state and a surplus electron. Due to the relatively weak electronegativity, the surplus electron isn't trapped on the Ti center but it is localized at Fe sites. Therefore, the surplus electron has almost no effect on the conductivity, which is consistent with previous results.23,34 Although the Ti4+ ion has no magnetic moment due to its closed shell electronic configuration, its calculated magnetic moment of Ti4+ is −0.07 μB (replacing a spin-up Fe3+ ion of 5 μB). Each Fe atom has a magnetic moment of −3.79 μB. Thus, the total magnetic moment of the α-FeTiO3 unit cell is −24 μB, opposite to that of the replaced Fe. Electrically, α-FeTiO3 is an insulator. The band gaps are 2.8 and 2.4 eV for the spin-up and spin-down channels, respectively. Compared with α-Fe2O3, Ti introduction makes the Ti-3d state into the CBM and decreases the electron effective mass due to the relatively weak localization of the Ti-3d state, which results in a higher mobility of electrons. This result is consistent with the previously reported experimental results6,21 that the Ti-doping in α-Fe2O3 plays a positive role in improving the PEC performance.
When the spin-up Fe atoms are replaced by V, α-FeVO3 is also predicted to be an insulator in both the spin-up and spin-down channels, as shown in Fig. 4(c). Vanadium (3d34s2) donates two s electrons and one d electron to the O atoms, leaving two occupied V d levels. In the calculated the DOS, two occupied states are in the spin-up channel below the Fermi level, hybridizing with the O-2p state near the VBM. The unoccupied states fall on the site of the unoccupied Fe-3d state and upper energy states. The spin-up band gap is 1.12 eV, which is much narrower than that of α-Fe2O3. Also, a more dispersive CBM is beneficial for improving the carrier mobility to enhance PEC performance. The calculated magnetic moment per V3+ ion is 2.06 μB and each Fe3+ ion has a magnetic moment of −4.04 μB. Due to the hybridization of O-2p with the Fe-3d and V-3d states, each O2− ion has a magnetic moment of −0.34 μB polarized oppositely to the moment of the replaced spin-up Fe ions. Therefore, α-FeVO3 has a net moment of −18 μB.
In α-FeCrO3, the behavior depicted in Fig. 4(d) is predicted. It is well known that each Cr atom has six valence electrons that form the electronic configuration of 3d54s1. By substitution of Cr for the spin-up Fe, Cr (3d54s1) loses one s electron and two d electrons, and forms a Cr3+ charge state. The remaining three filled states fall just below the Fermi energy, hybridizing with the O-2p state in the spin-up channel of the VBM; the unoccupied states fall on the site of unfilled Fe-3d state and upper energy states, as shown in Fig. 4(d). Although the system remains an insulator, its CBM is more dispersive than that of α-Fe2O3 and the spin-up band gap is 1.45 eV, which is much smaller than that of α-Fe2O3. This reduction may enhance the conductivity due to improved carrier mobility.34 The Cr3+ ion has a magnetic moment of 3.3 μB and each Fe3+ ion has a magnetic moment of −4.1 μB. As mentioned above, owing to the exchange interaction among the O-2p with the Fe-3d and Cr-3d states, each O2− ion has a magnetic moment of −0.4 μB. Thus, α-FeCrO3 has a net moment of −12 μB, which is opposite to the moment of the replaced Fe.
After introducing M (M = Cu, Cd, In, Sc, Ti, V, and Cr) into α-Fe2O3, the electronic structure of α-FeMO3 shows some surprising changes, such as the emergence of half-metallic character and a large net magnetic moment. In particular, the systems with M = Cu and Cd show half-metallic character and p-type conductivity, improving the conductivity to suppress the recombination of electron–hole pairs and promoting the chance for the carriers to participate in a photo-oxidation reaction. Although no half-metallic behavior appears for M = Sc, Ti, V and Cr, these systems display a ferromagnetic insulating ground state, which is consistent with other theoretical results.52 Furthermore, for α-FeMO3, the calculated negative formation energies Ef detailed in Table 1 indicate that α-FeMO3 systems are thermodynamically stable. While the DFT prediction that α-FeMO3 systems are thermodynamically stable is intriguing, they will ultimately require experimental corroboration. The importance of experimental validation of hypothetical structures predicted with DFT is discussed in detail by Hector and Herbst.53
3.2. Optical properties
Due to the potential application in PEC and other optical devices, it is important to investigate the optical properties of α-FeMO3 (M = Sc, Ti, V, Cr, Cu, Cd and In). For this purpose, it is necessary to calculate the complex dielectric function, ε = ε1(w) + iε2(w). According to the Kramers–Kronig relationship between the real part ε1(w) and imaginary part ε2(w), the real part is evaluated from the imaginary part.54The calculated ε2(w) values of α-FeMO3 are shown in Fig. 5. For α-Fe2O3, two peaks can be observed. The P1 peak at 3.22 eV results from the electron transition from the O-2p state into the VBM and Fe-3d states in the CBM; the broader P2 peak at 11.45 eV likely arises from the transition between the deeper valence band and conduction band. After introducing Cu and Cd into α-Fe2O3, a new peak appears at a lower energy of 0.255 eV. This new peak can be attributed to the electron transition from the occupied O-2p states near the Fermi level into unoccupied states, which is consistent with its half-metallic character. Additionally, the P1 peak of α-FeCuO3 and α-FeCdO3 shifts to 3.05 and 4.03 eV, respectively, which is consistent with the change of band gap in the spin-up channel. However, the new peak at a lower energy is not observed in α-FeInO3, but it is observed that the P1 peak shifts to a higher energy due to a larger band gap in the spin-up channel. Furthermore, the calculated ε2(w) of α-FeMO3 (M = Sc, Ti, V, Cr) around the P1 and P2 peaks are almost similar, which is a result of their similar band structures and density of states. Moreover, the single P1 peak of α-FeMO3 (M = Sc, V, Cr) emerges into double peaks, which correspond to the difference of the band gap between the spin-up and spin-down channels. Meanwhile, for M = Sc, Ti, V, Cr, the P2 peak gradually moves to a higher energy and the intensity of the P2 peak is gradually weakened. However, compared with α-Fe2O3, the intensity of the P2 peak is enhanced.
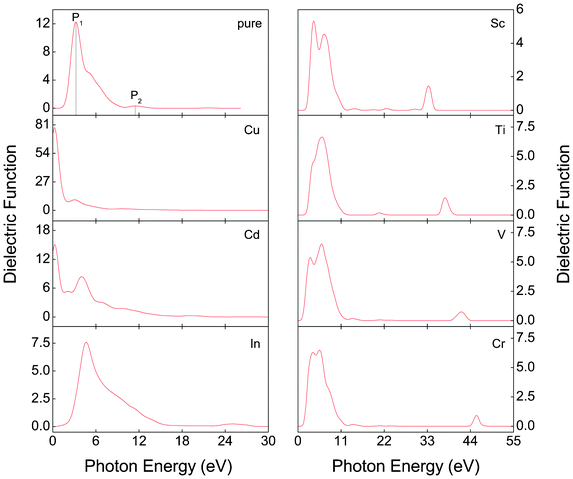 | ||
| Fig. 5 The imaginary part ε2(w) of the dielectric function of α-FeMO3 with M = Cu, Cd, In, Sc, Ti, V and Cr. | ||
Fig. 6 shows the optical absorption spectra of all α-FeMO3 systems considered in this study. It is clear that the absorption region of the systems with M = Cu and Cd is very wide, and the main absorption part still locates in the ultraviolet (UV) (i.e. short wavelength) region of the visible region. Compared with the absorption spectra of α-Fe2O3, the absorption edges of the systems with M = Cu and Cd shift toward the longer wavelength region, which can be attributed to the appearance of half-metallic character. Moreover, multiple peaks appear in the absorption spectra of the systems with M = Cu and Cd. The absorption intensity of the systems with M = Sc, Ti, V and Cr is significantly enhanced, which indicates that substitution of these constituents may improve the PEC performance and enhance the utilization of solar energy in the resulting α-FeMO3 materials. Furthermore, the absorption edges of α-FeMO3 systems without M = Cu and Cd shift toward shorter wavelengths, which is consistent with the band gap becoming wider than that of pure α-Fe2O3. Especially in the absorption spectra of α-FeMO3 with M = Sc, Ti, V and Cr, some sharpened absorption peaks appear in the 29–40 nm range. The appearance of these peaks in the short wavelength region suggests that the utilization of UV light is significantly improved.
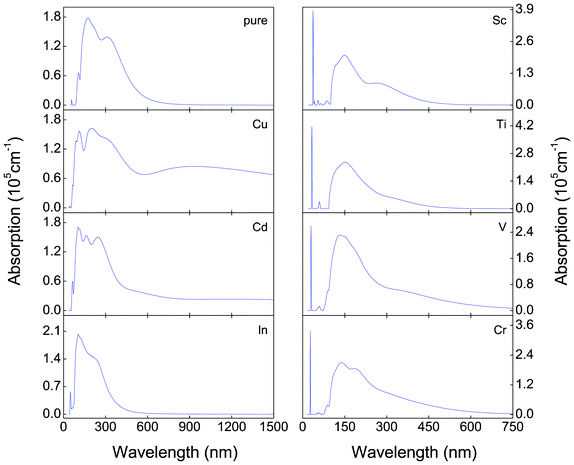 | ||
| Fig. 6 Optical absorption spectra of calculated for various types of α-FeMO3 with M = Cu, Cd, In, Sc, Ti, V and Cr. | ||
Fig. 7–9 show, respectively, the reflectivity R(w), refractive index n(w), and energy-loss function L(w) spectra of the α-FeMO3 systems. For α-FeMO3 (M = Sc, Ti, V and Cr) in a photon energy range of 0–13 eV, the reflectivity and refractivity display an opposite trend. The low energy range of 0–3 eV is characterized by small reflectivity and the strongest refractivity, while in the 3–13 eV range, the refractivity goes through a change from the strongest to the weakest, and the reflectivity reaches the strongest value at ∼12.5 eV. In a photon energy range of 34–47 eV, the reflectivity and refractivity of α-FeMO3 (M = Sc, Ti, V and Cr) have the second strongest peak and a change from the second strongest one to the second weakest one, respectively. The energy loss function describes the energy loss of the electrons traversing the materials. The sharp peaks located at 12–13 and 34, 39, 42, 46 eV also correspond to the trend of the reflectivity spectrum. With M = Cu and Cd, the reflectivity and refractivity show a decreasing trend with increasing energy in the whole region. However, the reflectivity and refractivity spectra of α-Fe2O3 and α-FeInO3 show an increase then a gradual decrease with an obvious peak.
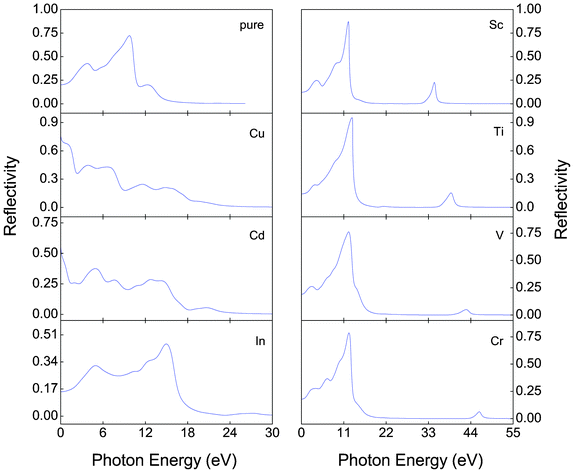 | ||
| Fig. 7 Reflectivity R(w) of α-FeMO3 with M = Cu, Cd, In, Sc, Ti, V and Cr. | ||
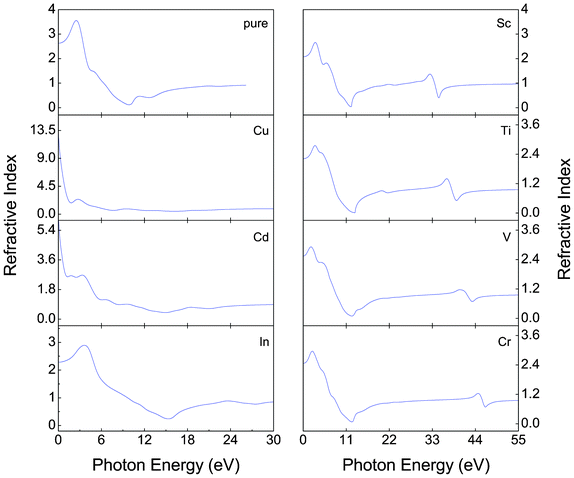 | ||
| Fig. 8 Refractivity index n(w) of α-FeMO3 with M = Cu, Cd, In, Sc, Ti, V and Cr to the photon energy. | ||
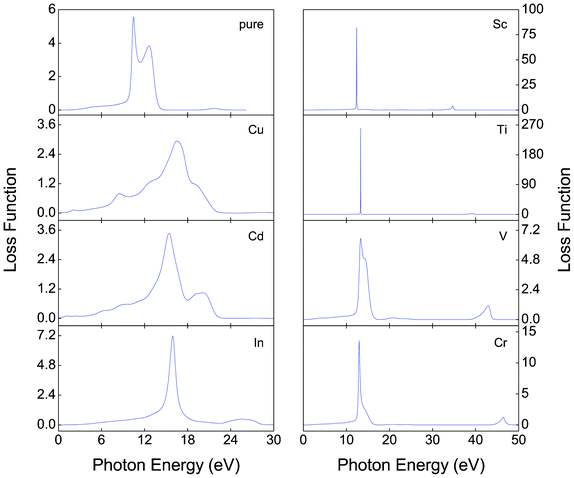 | ||
| Fig. 9 Energy-loss functions L(w) of α-FeMO3 with M = Cu, Cd, In, Sc, Ti, V and Cr. | ||
Although much experimental work has been carried out on improving the PEC performance by doping, few reports show the results from a systematic theoretical study of relevant optical properties. In this study, the optical properties of α-FeMO3 have been systematically investigated, including absorption coefficient α(w), reflectivity R(w), refractivity index n(w), and energy-loss L(w). For systems with M = Cu and Cd, the enhancement of conductivity and strong absorption in the visible region suggests potential improvements in PEC performance, such as increasing the carrier concentration, suppressing electron–hole recombination and improving the utilization of solar energy. For α-FeTiO3, the enhanced absorption coefficient may be beneficial for improving the PEC performance, which is consistent with the experimental results.6,21 In addition, for M = Sc, V, and Cr, the strongest peaks are observed in the short wavelength region of the absorption spectra.
4. Conclusion
First-principle calculations were performed to study the electronic structure and optical properties of α-FeMO3 systems. Most of the substituted elements can be viewed as cations with a three valence electron configuration substituting for Fe3+ in the α-Fe2O3 lattice except Cu2+, Cd2+ and Ti4+. The systems with M = Cu and Cd are p-type, display a half-metallic character, and hold promise for enhancing the electrical conductivity of these materials and extending the life of carriers. The absorption peaks in the visible light region are enhanced in α-FeMO3 systems with M = Cu and Cd. In the systems with M = Sc, Ti, V and Cr, the absorption spectra indicate that the strong absorption peaks shift toward the short wavelength region. A large magnetic moment appears in each α-FeMO3 material. We conclude that transition metal doping is an effective way of improving the electronic structure and optical properties of α-FeMO3 systems.Acknowledgements
This work was supported by National Natural Science Foundation of China (51171126) and the Key Project of the Natural Science Foundation of Tianjin City (12JCZDJC27100).References
- M. N. Baibich, J. M. Broto, A. Fert, F. Nguyen van Dau, F. Petroff, P. Etienne, G. Creuzet, A. Friederich and J. Chazelas, Phys. Rev. Lett., 1988, 61, 2472 CrossRef CAS.
- G. Binasch, P. Grünberg, F. Saurenbach and W. Zinn, Phys. Rev. B, 1989, 39, 4828 CrossRef CAS.
- A. Fujishima and K. Honda, Nature, 1972, 238, 37 CrossRef CAS.
- A. Fujishima and K. Honda, Bull. Chem. Soc. Jpn., 1971, 44, 1148 CrossRef CAS.
- X. Y. Meng, G. W. Qin, S. Li, X. H. Wen, Y. P. Ren, W. L. Pei and L. Zuo, Appl. Phys. Lett., 2011, 98, 112104 CrossRef.
- M. L. Zhang, W. J. Luo, Z. S. Li, T. Yu and Z. G. Zou, Appl. Phys. Lett., 2010, 97, 042105 CrossRef.
- T. Morikawa, K. Kitazumi, N. Takahashi, T. Arai and T. Kajino, Appl. Phys. Lett., 2011, 98, 242108 CrossRef.
- A. Kay, I. Cesar and M. Grätzel, J. Am. Chem. Soc., 2006, 128, 15714 CrossRef CAS.
- B. M. Klahr and T. W. Hamann, Appl. Phys. Lett., 2011, 99, 063508 CrossRef.
- Y. S. Hu, A. Kleiman-Shwarsctein, A. J. Forman, D. Hazen, J. N. Park and E. W. McFarland, Chem. Mater., 2008, 20, 3803 CrossRef CAS.
- C. M. Eggleston, Science, 2008, 320, 184 CrossRef CAS.
- R. Yu, Z. M. Li, D. Wang, X. Y. Lai, C. J. Xing and X. R. Xing, Solid State Sci., 2009, 11, 2056 CrossRef CAS.
- B. C. Faust, M. R. Hoffmann and D. W. Bahnemann, J. Phys. Chem., 1989, 93, 6371 CrossRef CAS.
- R. J. S. Lima, J. R. Jesus, K. O. Moura, C. B. R. Jesus, J. G. S. Duque and C. T. Meneses, J. Appl. Phys., 2011, 109, 123905 CrossRef.
- C. J. Sartoretti, B. D. Alexander, R. Solarska, I. A. Rutkowska, J. Augustynski and R. Cerny, J. Phys. Chem. B, 2005, 109, 13685 CrossRef CAS.
- A. Watanabe and H. Kozuka, J. Phys. Chem. B, 2003, 107, 12713 CrossRef CAS.
- A. Kleiman-Shwarsctein, Y. S. Hu, A. J. Forman, G. D. Stucky and E. W. McFarland, J. Phys. Chem. C, 2008, 112, 15900 CAS.
- W. B. Ingler, J. P. Baltrus and S. U. M. Khan, J. Am. Chem. Soc., 2004, 126, 10238 CrossRef CAS.
- S. Kumari, C. Tripathi, A. P. Singh, D. Chauhan, R. Shrivastav, S. Dass and V. R. Satsangi, Curr. Sci., 2006, 91, 1062 CAS.
- A. Kleiman-Shwarsctein, M. N. Huda, A. Walsh, Y. F. Yan, G. D. Stucky, Y. S. Hu, M. M. Al-Jassim and E. W. McFarland, Chem. Mater., 2010, 22, 510 CrossRef CAS.
- J. A. Glasscock, P. R. F. Barnes, I. C. Plumb and N. Savvides, J. Phys. Chem. C, 2007, 111, 16477 CAS.
- A. Bandyopadhyay, J. Velev, W. H. Butler, S. K. Sarker and O. Bengone, Phys. Rev. B: Condens. Matter Mater. Phys., 2004, 69, 174429 CrossRef.
- T. Droubay, K. M. Rosso, S. M. Heald, D. E. McCready, C. M. Wang and S. A. Chambers, Phys. Rev. B: Condens. Matter Mater. Phys., 2007, 75, 104412 CrossRef.
- M. D. Segall, P. L. D. Lindan, M. J. Probert, C. J. Pickard, P. J. Hasnip, S. J. Clark and M. C. Payne, J. Phys.: Condens. Matter, 2002, 14, 2717 CrossRef CAS.
- J. Wrobel, L. G. Hector Jr., W. Wolf, S. L. Shang, Z.-K. Liu and K. J. Kurzydłowski, J. Alloys Compd., 2012, 512, 296 CrossRef CAS.
- S. Ganeshan, L. G. Hector Jr. and Z.-K. Liu, Comput. Mater. Sci., 2010, 50, 301 CrossRef CAS.
- D. Vanderbilt, Phys. Rev. B: Condens. Matter, 1990, 41, 7892 CrossRef.
- H. J. Monkhorst and J. D. Pack, Phys. Rev. B: Solid State, 1976, 13, 5188 CrossRef.
- B. G. Pfrommer, M. Cote, S. G. Louie and M. L. Cohen, J. Comput. Phys., 1997, 131, 233 CrossRef CAS.
- J. Y. Cao, T. Kako, N. K. Kikugawa and J. H. Ye, J. Phys. D: Appl. Phys., 2010, 43, 325101 CrossRef.
- S. Kevin, L. F. Formal and M. Grätzel, ChemSusChem, 2011, 4, 432 CrossRef.
- M. Catti, G. Va1erio and R. Dovesi, Phys. Rev. B: Condens. Matter, 1995, 51, 7441 CrossRef CAS.
- C. G. Shull, W. A. Strauser and E. O. Wollan, Phys. Rev., 1951, 83, 333 CrossRef CAS.
- M. N. Huda, A. Walsh, Y. F. Yan, S. H. Wei and M. M. Al-Jassim, J. Appl. Phys., 2010, 107, 123712 CrossRef.
- R. J. Lad and V. E. Henrich, Phys. Rev. B, 1989, 39, 13478 CrossRef CAS.
- Z. D. Pozun and G. Henkelman, J. Chem. Phys., 2011, 134, 224706 CrossRef.
- X. G. Wang, W. Weiss, S. K. Shaikhutdinov, M. Ritter, M. Petersen, F. Wagner, R. Schlögl and M. Scheffler, Phys. Rev. Lett., 1998, 81, 1038 CrossRef CAS.
- L. M. Sandratskii, M. Uhl and J. Kübler, J. Phys.: Condens. Matter, 1996, 8, 983 CrossRef CAS.
- G. Rollmann, A. Rohrbach, P. Entel and J. Hafner, Phys. Rev. B: Condens. Matter Mater. Phys., 2004, 69, 165107 CrossRef.
- L. G. Hector Jr., J. F. Herbst and T. W. Capehart, J. Alloys Compd., 2003, 353, 74 CrossRef.
- L. G. Hector Jr. and J. F. Herbst, J. Alloys Compd., 2004, 379, 41 CrossRef.
- S. L. Dudarev, G. A. Botton, S. Y. Savrasov, C. J. Humphreys and A. P. Sutton, Phys. Rev. B: Condens. Matter Mater. Phys., 1998, 57, 1505 CrossRef CAS.
- Y. Wang, L. G. Hector Jr., H. Zhang, S. L. Shang, L. Q. Chen and Z.-K. Liu, Phys. Rev. B: Condens. Matter Mater. Phys., 2008, 78, 104113 CrossRef.
- S. Shang, L. G. Hector Jr., Y. Wang, H. Zhang and Z.-K. Liu, J. Phys.: Condens. Matter, 2009, 21, 246001 CrossRef.
- J. F. Herbst and L. G. Hector Jr., Phys. Rev. B: Condens. Matter Mater. Phys., 2012, 85, 195137 CrossRef.
- H. Wang, Y. Chen, Y. Kaneta and S. Iwata, J. Alloys Compd., 2010, 491, 550 CrossRef CAS.
- X. Y. Yu, C. S. Li, Y. Ling, T. A. Tang, Q. Wu and J. Kong, J. Alloys Compd., 2010, 507, 33 CrossRef CAS.
- L. Y. Li, W. H. Wang, H. Liu, X. D. Liu, Q. G. Song and S. W. Ren, J. Phys. Chem. C, 2009, 113, 8460 CAS.
- J. E. Jaffe, M. Dupuis and M. Gutowski, Phys. Rev. B: Condens. Matter Mater. Phys., 2004, 69, 205106 CrossRef.
- G. Dräger, W. Czolbe and J. A. Leiro, Phys. Rev. B: Condens. Matter, 1992, 45, 8283 CrossRef.
- C. Y. Kim, M. J. Bedzyk, E. J. Nelson, J. C. Woicik and L. E. Berman, Phys. Rev. B: Condens. Matter, 2002, 66, 085115 CrossRef.
- J. Velev, A. Bandyopadhyay, W. H. Butler and S. Sarker, Phys. Rev. B: Condens. Matter Mater. Phys., 2005, 71, 205208 CrossRef.
- L. G. Hector Jr. and J. F. Herbst, J. Phys.: Condens. Matter, 2008, 20, 064229 CrossRef.
- R. S. Zhang, Y. Liu, Q. Gao, F. Teng, C. L. Song, W. Wang and G. R. Han, J. Alloys Compd., 2011, 509, 9178 CrossRef CAS.
| This journal is © The Royal Society of Chemistry 2012 |
