DOI:
10.1039/C1RA00301A
(Paper)
RSC Adv., 2011,
1, 874-883
Structure and energetics of low-index stoichiometric monoclinic clinobisvanite BiVO4 surfaces
Received
14th June 2011
, Accepted 1st July 2011
First published on 8th September 2011
Abstract
In the present work, density functional theory calculations were employed to study the surface properties of several low-index stoichiometric monoclinic clinobisvanite BiVO4 surfaces. Their surface properties were systemically calculated and described in details, and the similarities and differences between these surfaces were compared and analyzed. Finally, on the basis of calculated surface energies, the equilibrium crystal shape of monoclinic clinobisvanite BiVO4 was determined, and its average surface energy was estimated. The calculated results indicated that the dangling bond density of the bismuth atom determines not only the surface energy, but also the surface relaxation.
1. Introduction
Besides yellow pigment, bismuth vanadate (BiVO4) is widely used in many fields because of its important performances, such as, ferroelasticity, photochromic effect, ionic conductivity, and so on. Recently, it is observed that BiVO4 shows high photocatalytic activity of O2 evolution from water-splitting, and organics degradation under visible-light irradiation.1–8 It has both a narrow band gap (2.4–2.5 eV)2,9 and the reasonable band edge alignment with respect to the water redox potentials.10 Therefore, it can be used as the essential materials for solar cells, renewable energy, environment purification, and other relevant applications.
As known, BiVO4 has three polymorphs, orthorhombic pucherite, tetragonal dreyerite, and monoclinic clinobisvanite. Compared with other polymorphs, the clinobisvanite structure is the thermodynamically stable phase, and exhibits excellent photocatalytic activity and photoelectrochemical behavior.1,2,5,6 In our previous work, we had systematically investigated its electronic structure and optical properties,11 and the ion doping effects.12 In addition, in the field of photocatalysis, surface factors (surface orientations, surface structures, surface electronic structures, etc.) will have critical impacts on the nature of the photocatalytic activity. When the photocatalyst of BiVO4 exposes more facets of {010} or {001}, it exhibits greatly enhanced photocatalytic activity.13–15 There are many experimental technology methods (for example, STM, XPS, EELS, LEED) to explore the surface structure. But nowadays, it is still difficult to provide further detailed surface information at the atomic-level using these experimental methods. Theoretical calculations based on density functional theory (DFT) have been proven extremely useful and powerful in elucidating the relationship between surface structure and physical chemical properties of catalyst. So far, there are some published theoretical studies for BiVO4.9,16–22 However, in these literatures, only a few studies focused its surface properties.21,22 So, the nature and morphology of the topmost surface layer and its properties are still quite unclear issues. Thus, the aim of the present work is to investigate the properties of different surfaces through systemically DFT calculations. The present work mainly focused on the relationship between surface structure and stability of monoclinic clinobisvanite BiVO4. Finally, the thermodynamic equilibrium crystal shape of clinobisvanite BiVO4 as determined through the Wulff construction is also reported.
This paper is organized as follows: the motivation and purpose of the present work are briefly mentioned in Section 1. The computational details are described in Section 2. In Section 3, we firstly briefly describe the bulk structure properties of clinobisvanite BiVO4. Next, we report the calculation results for every surface, respectively. And then, we summarize the surface properties and discuss the relationship between surface structure and stability. Finally, the calculated results are summarized to draw some conclusions in Section 4.
2. Computational method and details
All of the DFT calculations in this work have been performed by the Cambridge Serial Total Energy Package (CASTEP) codes.23 The ultrasoft pseudopotential was chosen in the calculations because of its advantages in both efficiency and credibility. The Kohn–Sham wave functions of the valence electrons were expanded using a plane wave basis set within a specified energy cutoff that was chosen at 380 eV. Exchange and correlation effects were described by the Perdew–Burke–Ernzerhof (PBE) within generalized gradient approximation (GGA).24 The Monkhorst–Pack scheme k-points grid sampling was set as 3 × 3 × 1 for the irreducible Brillouin zone. A 50 × 50 × 375 mesh was used for fast Fourier transformation. The minimization algorithm was chosen Broyden-Fletcher-Goldfarb-Shanno (BFGS) scheme.25 In order to get reasonable results, the atomic coordinates are firstly optimized by minimizing the total energy and atomic forces. This was an iterative process in which the coordinates of the atoms were adjusted so that the total energy of the structure was minimized, and through which the equilibrium structure could be obtained. The iterative process was considered convergences, when the force on the atom was less than 0.01 eV Å−1, the stress on the atom was less than 0.02 GPa, the atomic displacement was less than 5 × 10⁻⁴ Å, and the energy change per atom was less than 5 × 10⁻⁶ eV.
In order to describe the surfaces, the slab method was used to model solid surfaces. All of the surfaces were modeled using slabs of up to 16 layers of BiVO4. A vacuum space of 20 Å has been used to separate the slab from its periodic image along the surface normal direction. The central four layers of the slab were kept fixed at the bulk positions and the six outermost layers of atoms on both sides of the slab were relaxed by the method mentioned above. For each surface, there are some different possible termination planes. The surface energy of every possible terminated plane were firstly calculated, and the most stable plane was selected, which has the minimum of surface energy, for further surface calculations.
3. Results and discussions
3.1. Monoclinic clinobisvanite BiVO4 bulk structure
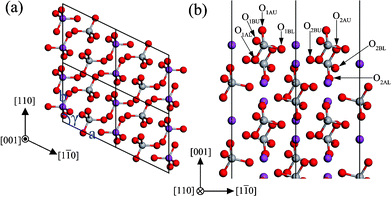
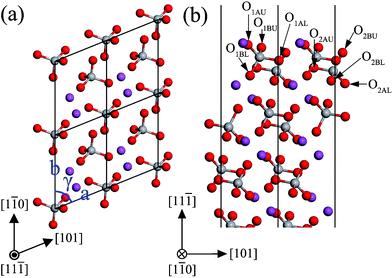
The bulk structure of monoclinic clinobisvanite BiVO4 is shown in Fig. 1. Its point group is C62h, and space group is C2/c, which can be converted to I/2b as Liu et al. reported.26 The optimized lattice parameters as follows: a = 7.224 Å, b = 11.522 Å, c = 5.108 Å, and β = 135.003°, which is consist with experimental results:26,27a = 7.258 Å, b = 11.706 Å, c = 5.084 Å, and β = 134.073°, in which we had converted its space group from I2/b to C2/c as ref. 26, in order to direct comparison. This indicates that our computational method is reliable. The basic structure of BiVO4 in the monoclinic phase is constructed by VO4 tetrahedrons and BiO8 dodecahedrons. Therefore, their saturated coordination numbers are listed as the following: 3-fold coordinated oxygen, 4-fold coordinated vanadium, and 8-fold coordinated bismuth, respectively. The bond lengths of Bi–O (∼2.43 Å) are much larger than that of V–O (∼1.73 Å). This means that the interaction of V atoms with O atoms is relatively stronger than the interaction of Bi atoms with O atoms in monoclinic BiVO4. So the present work mainly focused on the former. Bi atoms and V atoms are alternately arranged along the crystal axis, consequently resulting in monoclinic clinobisvanite BiVO4 exhibiting the characteristics of a layered structure. However, along different axes, the arrangements of Bi and V atoms are different: the –Bi–V– configuration along the a- and c-axis, and the –Bi–V–V–Bi– configuration along the b-axis. In the VO4 tetrahedron, there are two type of atoms, which are labeled by “A” and “B” in Fig. 1. The corresponding bond length and bond angle are also displayed in Fig. 1. We found that the behaviors of these two types of O atoms are different in the surface models. More details will be discussed in the following sections.
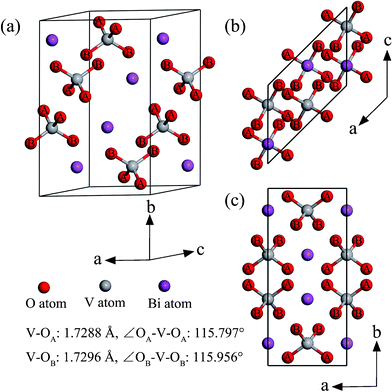 |
| | Fig. 1 Bulk BiVO4 crystal structure in the monoclinic clinobisvanite phase: (a) the perspective view, (b) the top view, (c) the side view. The type of oxygen atom is denoted by “A” and “B”. The bond lengths and bond angles of the VO4 tetrahedrons are also shown. | |
3.2. Monoclinic clinobisvanite BiVO4 surface structures
To investigate how the surface energy relates to the surface structure, we will show the relaxed surface structures in this section and provide the atomic displacements, the bond length and bond angle expansion, and the lay spacing expansion. Furthermore, the electron density difference and the electrostatic potential as a function of distance from the surface are also provided.
3.2.1. The (010) surface.
The monoclinic clinobisvanite BiVO4 (010) surface has four possible terminations. The most stable termination is illustrated in Fig. 2, and the important structural parameters after surface relaxation are listed in Table 1. The most stable (010) surface exposes fully 4-fold coordinated V atoms, as well as coordinately unsaturated atoms, two 2-fold coordinated O atoms and a 6-fold coordinated Bi atom (denoted O1A and Bi1 in Fig. 2(b), respectively). The (010) slab shows stacks of VO4 tetrahedron units along the [010] direction. For each unit, the same types of O atoms are located at the same height. They are completely equivalent as well as in the bulk phase. The tetrahedrons on adjacent layers along the [010] direction have the same type of O atoms. The most important inward relaxations are those atoms in the first layer, especially the unsaturated Bi1 (∼−0.12 Å). On the contrary, those atoms in the second layer are displaced outward by ∼0.03 Å. The same situation also appears in the third and fourth layers. But the relaxations are not very significant in these two layers. Accordingly, the expansions of bond length and bond angle in the outermost two layers are much larger than that in the below two layers. From the layer spacing expansions, it is found that the surface relaxation is not important for the sixth layer. So the atoms in the sixth layer are located on the positions of the bulk-truncated surface.
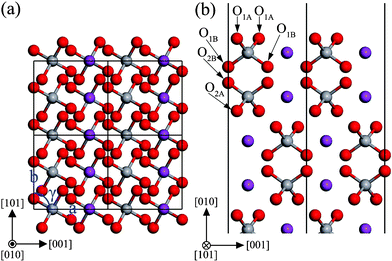 |
| | Fig. 2 The structure of the unrelaxed stoichiometric (010) surface: (a) top view, (b) side view. The atomic labels are the same as that in Table 1. | |
Table 1 Structure of the relaxed (010) surface. Atom labels refer to Fig. 2. The left panel shows the atomic displacements from the bulk-truncated ideal positions, along surface normal direction. The central panel shows the expansion of the bonds and bond -angles between V atoms and its nearest neighbors, as a percentage from the bulk corresponding values: V–OA (V–OB) bonds are 1.7288 Å (1.7296 Å); ∠OA–V–OA (∠OB–V–OB) bond angles are 115.797° (115.956°). The right panel shows the expansion of lay spacing, as a percentage from the bulk corresponding values: 2.878 Å and 2.886 Å
| Atomic displacement/Å |
Bond and bond angle expansion |
Lay spacing expansion |
| Label |
[010] |
Label |
[010] |
Label |
% |
Label |
% |
Label |
% |
|
In the tables and figures, the subscript of elemental symbol indicates atomic position in the slab model. The first number indicates the ordinal number of layer in which the atom is located. The second capital letter indicates the type of oxygen atom, “A” or “B”, as mentioned in the text. The third capital letter indicates the position of oxygen atom in the VO4 tetrahedron, “Upper” or “Lower”. For example, “O1AU” means the upper “A” type oxygen atom in the first layer.
|
|
O1Aa |
−0.049 |
O3A |
−0.017 |
V1–O1A |
−3.24 |
∠O1A–V1–O1A |
−3.05 |
d
12
|
−4.21 |
|
O1B |
−0.054 |
O3B |
−0.011 |
V1–O1B |
3.78 |
∠O1B–V1–O1B |
2.77 |
d
23
|
2.74 |
| V1 |
−0.062 |
V3 |
−0.020 |
V2–O2A |
1.15 |
∠O2A–V2–O2A |
2.90 |
d
34
|
−0.94 |
|
Bi1 |
−0.121 |
Bi3 |
−0.014 |
V2–O2B |
−1.18 |
∠O2B-V2-O2B |
−2.61 |
d
45
|
0.31 |
|
O2A |
0.029 |
O4A |
0.006 |
V3–O3A |
−0.52 |
∠O3A–V3–O3A |
−0.52 |
d
56
|
−0.07 |
|
O2B |
0.033 |
O4B |
0.003 |
V3–O3B |
0.49 |
∠O3B–V3–O3B |
0.93 |
|
|
| V2 |
0.059 |
V4 |
0.007 |
V4–O4A |
0.19 |
∠O4A–V4–O4A |
0.21 |
|
|
|
Bi2 |
0.042 |
Bi4 |
0.004 |
V4–O4B |
−0.19 |
∠O4B–V4–O4B |
−0.40 |
|
|
In order to clearly display the effect of surface relaxation, the electron density difference (Δρ(z)) between before and after the (010) surface relaxation was plotted in Fig. 3(a). Near above the surface, the electron density of vacuum decreases after the surface relaxation. In the range of 0–−4 Å below the surface, the electron density of the BiVO4 layer increases, and the difference of electron density reaches the maximum. This means that electrons concentrate in this region after the surface relaxation. As the in-depth distance increase, this trend gradually disappears. The electrostatic potential (ϕ(z)) of the relaxed (010) surface is shown in Fig. 3(b). The average potential of the BiVO4 layer is ∼9.94 eV, and that in the middle of the vacuum layer is −1.29 eV.
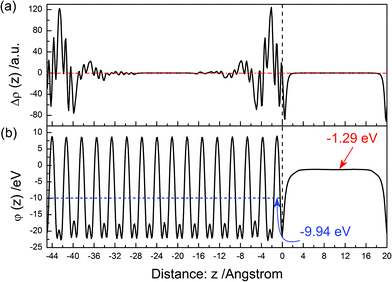 |
| | Fig. 3 (a) Calculated electron density difference as a function of distance from the surface. (b) Calculated electrostatic potential as a function of distance from the surface for the relaxed (010) surface. | |
3.2.2. The (100) surface.
The monoclinic clinobisvanite BiVO4 (100) surface has only one termination, which is illustrated in Fig. 4. The important structural parameters after surface relaxation are listed in Table 2. The (010) surface exposes fully 4-fold coordinated V atoms, as well as coordinately unsaturated atoms, two 1-fold coordinated O atoms, two 2-fold coordinated O atoms and two 5-fold coordinated Bi atom (denoted O1AU, O1BU and Bi1 in Fig. 4(b), respectively). The (100) slab also shows stacks of VO4 tetrahedron units along the [100] direction. For each unit, the same types of O atoms are located at different heights. Along the [010] direction, the adjacent tetrahedrons have the same type of O atoms, which are completely equivalent to each other. The most important inward relaxations are the unsaturated atoms, O1AU and Bi1 (∼−0.11 Å). While O1BU, O1BL and V1 atoms are displaced outward by ∼0.1 Å. Those atoms in the second layer are displaced outward by ∼0.07 Å, except O2BU. In the third layer, the atomic displacements are not very significant. Accordingly, the expansions of bond length and bond angle in the outermost two layers are much larger than that in the third layer. From the layer spacing expansions, it is found that the surface relaxation is not important for the third layer. So the atoms in the third layer are located on the positions of the bulk-truncated surface.
 |
| | Fig. 4 The structure of the unrelaxed stoichiometric (100) surface: (a) top view, (b) side view. The atomic labels are the same as that in Table 2. | |
Table 2 Structure of the relaxed (100) surface. Atom labels refer to Fig. 4, also see the caption of Table 1. The corresponding lay spacing in the bulk is 2.553 Å
| Atomic displacement/Å |
Bond and bond angle expansion |
Lay spacing expansion |
| Label |
[100] |
Label |
[100] |
Label |
% |
Label |
% |
Label |
% |
|
O1AU |
−0.105 |
O2BL |
0.017 |
V1–O1AU |
−8.16 |
V3–O3AL |
0.16 |
d
12
|
1.80 |
|
O1AL |
−0.071 |
V2 |
0.007 |
V1–O1AL |
4.41 |
V3–O3BU |
−0.41 |
d
23
|
0.78 |
|
O1BU |
0.087 |
Bi2 |
0.040 |
V1–O1BU |
0.57 |
V3–O3BL |
0.51 |
d
34
|
−0.47 |
|
O1BL |
0.100 |
O3AU |
−0.044 |
V1–O1BL |
6.07 |
∠O1AU–V1–O1AL |
−4.05 |
d
45
|
0.00 |
| V1 |
0.053 |
O3AL |
−0.026 |
V2–O2AU |
0.32 |
∠O1BU–V1–O1BL |
−7.45 |
d
56
|
0.00 |
|
Bi1 |
−0.116 |
O3BU |
0.007 |
V2–O2AL |
−0.57 |
∠O2AU–V2–O2AL |
2.85 |
|
|
|
O2AU |
0.078 |
O3BL |
0.006 |
V2–O2BU |
2.43 |
∠O2BU–V2–O2BL |
−1.73 |
|
|
|
O2AL |
0.040 |
V3 |
−0.012 |
V2–O2BL |
1.90 |
∠O3AU–V3–O3AL |
−0.78 |
|
|
|
O2BU |
−0.040 |
Bi3 |
−0.007 |
V3–O3AU |
−0.64 |
∠O3BU–V3–O3BL |
−0.12 |
|
|
The electron density difference between before and after the (100) surface relaxation is shown in Fig. 5(a). Near above the surface, the electron density of the vacuum decreases after the surface relaxation. At the surface position, the value of Δρ(z) reaches the maximum, then it decreases with an increase in the distance. About the position, ∼−4 Å, it reaches the minimum. This means that electrons concentrate at the surface after the surface relaxation. As the in-depth distance increase, this oscillating trend gradually disappears. The electrostatic potential of the relaxed (100) surface is shown in Fig. 5(b). The average potential of the BiVO4 layer is −9.37 eV, and that of the middle of the vacuum layer is −1.14 eV.
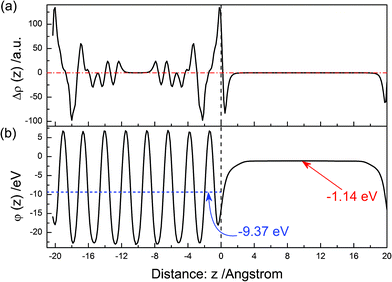 |
| | Fig. 5 The same as Fig. 3 but for the (100) surface. | |
3.2.3. The (001) surface.
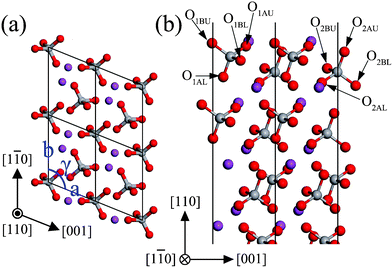
The monoclinic clinobisvanite BiVO4 (001) surface has two possible terminations. The most stable termination is illustrated in Fig. 6, and the important structural parameters after surface relaxation are listed in Table 3. The most stable (001) surface exposes fully 4-fold coordinated V atoms, as well as coordinately unsaturated atoms, a 1-fold coordinated O atom (O1AU), two 2-fold coordinated O atoms (O1BU and O2AU), a 5-fold coordinated Bi atom (Bi1) and a 7-fold coordinated Bi atom (Bi2). The VO4 tetrahedrons complicatedly stack in the (001) slab, in which the O atoms in the adjacent layer were stagger-arranged along the [001] direction. The most important inward relaxations are those atoms in the first layer, especially the unsaturated O1BU (∼−0.39 Å). But the O1BL atom is displaced outward by 0.073 Å. In the second layer, most atoms are displaced inward, especially O2AL (∼−0.36 Å), while the O2BU and V2 atoms are displaced outward by ∼0.1 Å. In the third and forth layers, most atoms are slightly displaced outward by ∼0.03 Å. Accordingly, the expansions of bond length and bond angle in the outermost two layers are much larger than that in the next two layers below. From the layer spacing expansions, it is found that the surface relaxation is not important for the sixth layer. So the atoms in the sixth layer are located on the positions of the bulk-truncated surface.
 |
| | Fig. 6 The structure of the unrelaxed stoichiometric (001) surface: (a) top view, (b) side view. The atomic labels are the same as that in Table 3. | |
Table 3 Structure of the relaxed (001) surface. Atom labels refer to Fig. 6, also see the caption of Table 1. The corresponding lay spacing in the bulk is 1.806 Å
| Atomic displacement/Å |
Bond and bond angle expansion |
Lay spacing expansion |
| Label |
[001] |
Label |
[001] |
Label |
% |
Label |
% |
Label |
% |
|
O1AU |
−0.251 |
O3AU |
0.049 |
V1–O1AU |
−7.21 |
V4–O4AU |
1.54 |
d
12
|
−13.07 |
|
O1AL |
−0.105 |
O3AL |
0.034 |
V1–O1AL |
2.41 |
V4–O4AL |
1.10 |
d
23
|
6.76 |
|
O1BU |
−0.393 |
O3BU |
−0.001 |
V1-O1BU |
0.17 |
V4–O4BU |
−0.99 |
d
34
|
0.00 |
|
O1BL |
0.073 |
O3BL |
0.034 |
V1–O1BL |
6.16 |
V4–O4BL |
0.69 |
d
45
|
−0.94 |
| V1 |
−0.123 |
V3 |
−0.001 |
V2–O2AU |
−7.72 |
∠O1AU–V1–O1AL |
−8.47 |
d
56
|
−0.61 |
|
Bi1 |
−0.158 |
Bi3 |
−0.015 |
V2–O2AL |
1.53 |
∠O1BU–V1–O1BL |
−0.12 |
|
|
|
O2AU |
−0.147 |
O4AU |
0.037 |
V2–O2BU |
6.56 |
∠O2AU–V2–O2AL |
6.65 |
|
|
|
O2AL |
−0.362 |
O4AL |
0.012 |
V2–O2BL |
1.66 |
∠O2BU–V2–O2BL |
9.13 |
|
|
|
O2BU |
0.080 |
O4BU |
−0.042 |
V3–O3AU |
0.22 |
∠O3AU–V3–O3AL |
2.00 |
|
|
|
O2BL |
−0.085 |
O4BL |
0.008 |
V3–O3AL |
−0.28 |
∠O3BU–V3–O3BL |
1.50 |
|
|
| V2 |
0.113 |
V4 |
−0.010 |
V3–O3BU |
0.05 |
∠O4AU–V4–O4AL |
0.70 |
|
|
|
Bi2 |
−0.044 |
Bi4 |
0.027 |
V3–O3BL |
−0.52 |
∠O4BU–V4–O4BL |
−0.97 |
|
|
The electron density difference between before and after the (001) surface relaxation is shown in Fig. 7(a). Near above the surface, the electron density of vacuum decreases after the surface relaxation. At the range of 0–−1 Å, the value of Δρ(z) is decreasing, and reaches the minimum at the position of ∼−1 Å. Then, it increases with an increase in the distance, and reaches a maximum at ∼−2 Å. This means that electrons concentrate in the range of −1–−3 Å after the surface relaxation. As the in-depth distance increases, this oscillating trend gradually disappears. The electrostatic potential of the relaxed (001) surface is shown in Fig. 7(b). The average potential of the BiVO4 layer is −9.19 eV, and that in the middle of the vacuum layer is −1.19 eV.
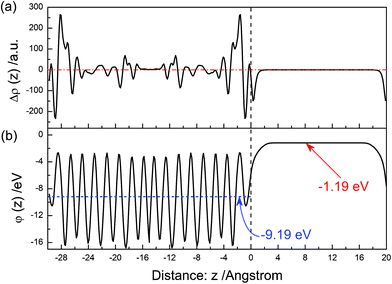 |
| | Fig. 7 The same as Fig. 3 but for the (001) surface. | |
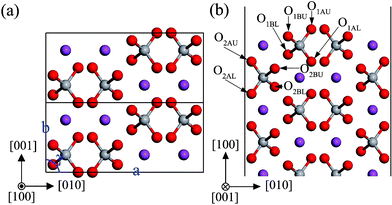
3.2.4. The (110) surface.
The monoclinic clinobisvanite BiVO4 (110) surface has four possible terminations. The most stable termination is illustrated in Fig. 8, and the important structural parameters after surface relaxation are listed in Table 4. The most stable (110) surface exposes fully 4-fold coordinated V atoms, as well as coordinately unsaturated atoms, three 2-fold coordinated O atoms (O1AU, O1BU, and O2AU) and a 5-fold coordinated Bi atom (Bi1). The VO4 tetrahedrons complicatedly stack in the (110) slab, in which the O atoms in the adjacent layer were stagger-arranged along the [110] direction. The most important outward relaxations are those atoms in the first layer (the displacements are about 0.16 Å), excepting the unsaturated Bi1 is displaced inward by ∼−0.22 Å. On the contrary, those atoms in the second layer are displaced inward by ∼0.05 Å. The same situation also appears in the third and fourth layers. But the relaxations are not very significant in these two layers. Accordingly, the expansions of bond length and bond angle in the outermost two layers are much larger than that in the next two layers below. From the layer spacing expansions, it is found that the surface relaxation is not important for the fifth layer. So the atoms in the fifth layer are located on the positions of the bulk-truncated surface.
 |
| | Fig. 8 The structure of the unrelaxed stoichiometric (110) surface: (a) top view, (b) side view. The atomic labels are the same as that in Table 4. | |
Table 4 Structure of the relaxed (110) surface. Atom labels refer to Fig. 8, also see the caption of Table 1. The corresponding lay spacing in the bulk is 1.168 Å, and 3.501 Å
| Atomic displacement/Å |
Bond and bond angle expansion |
Lay spacing expansion |
| Label |
[110] |
Label |
[110] |
Label |
% |
Label |
% |
Label |
% |
|
O1AU |
0.031 |
O3AU |
−0.023 |
V1–O1AU |
−1.69 |
V4–O4AU |
−0.25 |
d
12
|
13.34 |
|
O1AL |
0.129 |
O3AL |
0.005 |
V1–O1AL |
1.28 |
V4–O4AL |
−0.09 |
d
23
|
−1.09 |
|
O1BU |
0.164 |
O3BU |
0.010 |
V1–O1BU |
−3.04 |
V4–O4BU |
0.65 |
d
34
|
0.34 |
|
O1BL |
0.105 |
O3BL |
0.010 |
V1–O1BL |
3.62 |
V4–O4BL |
−0.27 |
d
45
|
0.00 |
| V1 |
0.127 |
V3 |
0.004 |
V2–O2AU |
−2.45 |
∠O1AU–V1–O1AL |
−3.04 |
d
56
|
0.17 |
|
Bi1 |
−0.223 |
Bi3 |
0.000 |
V2–O2AL |
0.40 |
∠O1BU–V1–O1BL |
−8.20 |
|
|
|
O2AU |
−0.049 |
O4AU |
−0.002 |
V2–O2BU |
2.79 |
∠O2AU–V2–O2AL |
3.11 |
|
|
|
O2AL |
0.002 |
O4AL |
0.011 |
V2–O2BL |
−1.54 |
∠O2BU–V2–O2BL |
1.06 |
|
|
|
O2BU |
−0.048 |
O4BU |
0.023 |
V3–O3AU |
−0.52 |
∠O3AU–V3–O3AL |
−0.89 |
|
|
|
O2BL |
−0.027 |
O4BL |
0.001 |
V3–O3AL |
0.16 |
∠O3BU–V3–O3BL |
−0.16 |
|
|
| V2 |
−0.029 |
V4 |
0.005 |
V3–O3BU |
−0.20 |
∠O4AU–V4–O4AL |
0.42 |
|
|
|
Bi2 |
0.022 |
Bi4 |
0.011 |
V3–O3BL |
0.60 |
∠O4BU–V4–O4BL |
0.67 |
|
|
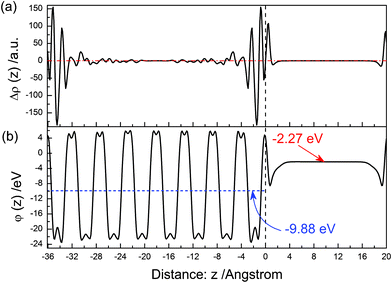
The electron density difference between before and after the (110) surface relaxation is shown in Fig. 9(a). Near above the surface, the electron density of the vacuum increases after the surface relaxation. At the range of 0∼−4 Å, the value of Δρ(z) is obviously oscillating with the increase of distance. And this phenomenon is gradually disappearing as the in-depth distance increase. The electrons concentrate in the range of 0∼−2 Å after the surface relaxation. The electrostatic potential of the relaxed (110) surface is shown in Fig. 9(b). The average potential of the BiVO4 layer is −9.88 eV, and that of in the middle of the vacuum layer is −2.27 eV.
 |
| | Fig. 9 The same as Fig. 3 but for the (110) surface. | |
3.2.5. The (11![[1 with combining macron]](https://www.rsc.org/images/entities/b_char_0031_0304.gif) ) surface.
The monoclinic clinobisvanite BiVO4 (11
) surface.
The monoclinic clinobisvanite BiVO4 (11![[1 with combining macron]](https://www.rsc.org/images/entities/char_0031_0304.gif) ) surface has four possible terminations. The most stable termination is illustrated in Fig. 10, and the important structural parameters after surface relaxation are listed in Table 5. The most stable (11) surface exposes fully 4-fold coordinated V atoms, as well as coordinately unsaturated atoms, three 2-fold coordinated O atoms (O1AU, O1BU, and O2BU) and a 5-fold coordinated Bi atom (Bi1). The VO4 tetrahedrons complicatedly stack in the (11) slab, in which the O atoms in the adjacent layer were stagger-arranged along the [11] direction. The most important outward relaxations are those atoms in the first layer (the displacements are about 0.12 Å), excepting the unsaturated Bi1 is displaced inward by ∼−0.23 Å. On the contrary, those atoms in the second layer are displaced inward by ∼0.06 Å. The same situation also appears in the third and fourth layers. But the relaxations are not very significant in these two layers. Accordingly, the expansions of bond length and bond angle in the outermost two layers are much larger than that of the next two layers below. From the layer spacing expansions, it is found that the surface relaxation is not important for the sixth layer. So the atoms in the sixth layer are located on the positions of the bulk-truncated surface.
) surface has four possible terminations. The most stable termination is illustrated in Fig. 10, and the important structural parameters after surface relaxation are listed in Table 5. The most stable (11) surface exposes fully 4-fold coordinated V atoms, as well as coordinately unsaturated atoms, three 2-fold coordinated O atoms (O1AU, O1BU, and O2BU) and a 5-fold coordinated Bi atom (Bi1). The VO4 tetrahedrons complicatedly stack in the (11) slab, in which the O atoms in the adjacent layer were stagger-arranged along the [11] direction. The most important outward relaxations are those atoms in the first layer (the displacements are about 0.12 Å), excepting the unsaturated Bi1 is displaced inward by ∼−0.23 Å. On the contrary, those atoms in the second layer are displaced inward by ∼0.06 Å. The same situation also appears in the third and fourth layers. But the relaxations are not very significant in these two layers. Accordingly, the expansions of bond length and bond angle in the outermost two layers are much larger than that of the next two layers below. From the layer spacing expansions, it is found that the surface relaxation is not important for the sixth layer. So the atoms in the sixth layer are located on the positions of the bulk-truncated surface.
 |
| | Fig. 10 The structure of the unrelaxed stoichiometric (11) surface: (a) top view, (b) side view. The atomic labels are the same as that in Table 5. | |
Table 5 Structure of the relaxed (11)surface. Atom labels refer to Fig. 10, also see the caption of Table 1. The corresponding lay spacing in the bulk is 1.167 Å and 3.502 Å
| Atomic displacement/Å |
Bond and bond angle expansion |
Lay spacing expansion |
| Label |
[11] |
Label |
[11] |
Label |
% |
Label |
% |
Label |
% |
|
O1AU |
0.016 |
O3AU |
0.009 |
V1–O1AU |
−2.95 |
V4–O4AU |
0.72 |
d
12
|
14.25 |
|
O1AL |
0.099 |
O3AL |
0.006 |
V1–O1AL |
3.61 |
V4–O4AL |
−0.20 |
d
23
|
−1.54 |
|
O1BU |
0.029 |
O3BU |
−0.023 |
V1–O1BU |
−1.77 |
V4–O4BU |
−0.32 |
d
34
|
1.12 |
|
O1BL |
0.122 |
O3BL |
0.007 |
V1–O1BL |
1.21 |
V4–O4BL |
−0.20 |
d
45
|
−0.31 |
| V1 |
0.123 |
V3 |
0.011 |
V2–O2AU |
2.88 |
∠O1AU–V1–O1AL |
−7.98 |
d
56
|
0.69 |
|
Bi1 |
−0.229 |
Bi3 |
−0.004 |
V2–O2AL |
1.55 |
∠O1BU–V1–O1BL |
−3.27 |
|
|
|
O2AU |
−0.052 |
O4AU |
0.026 |
V2–O2BU |
−2.52 |
∠O2AU–V2–O2AL |
1.50 |
|
|
|
O2AL |
−0.039 |
O4AL |
−0.005 |
V2–O2BL |
0.36 |
∠O2BU–V2–O2BL |
2.58 |
|
|
|
O2BU |
−0.066 |
O4BU |
−0.010 |
V3–O3AU |
−0.18 |
∠O3AU–V3–O3AL |
0.13 |
|
|
|
O2BL |
−0.008 |
O4BL |
0.009 |
V3–O3AL |
0.58 |
∠O3BU–V3–O3BL |
−1.15 |
|
|
| V2 |
−0.043 |
V4 |
−0.001 |
V3–O3BU |
−0.45 |
∠O4AU–V4–O4AL |
1.02 |
|
|
|
Bi2 |
0.020 |
Bi4 |
0.013 |
V3–O3BL |
0.10 |
∠O4BU–V4–O4BL |
−0.06 |
|
|
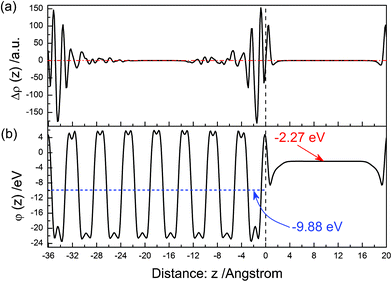
The electron density difference between before and after the (11) surface relaxation is shown in Fig. 11(a). Near above the surface, the electron density of vacuum increases after the surface relaxation. At the range of 0–−4 Å, the value of Δρ(z) is obviously oscillating with an increase in distance, and this phenomenon gradually disappears as the in-depth distance increases. The electrons concentrate in the range of 0–−2 Å after the surface relaxation. The electrostatic potential (ϕ(z)) of the relaxed (11) surface is shown in Fig. 11(b). The average potential of the BiVO4 layer is ∼9.88 eV, and that in the middle of the vacuum layer is −2.27 eV.
 |
| | Fig. 11 The same as Fig. 3 but for the (11) surface. | |
3.2.6. The (22) surface.
The monoclinic clinobisvanite BiVO4 (22) surface has four possible terminations. The most stable termination is illustrated in Fig. 12. In the monoclinic clinobisvanite BiVO4 structure, the metal atoms are adjacently linked with the same kind of metal atoms to form a continuous zigzag line on the (22) surface (shown in Fig. 12(a) by dashed lines), whose distances are about 3.85 Å. Thus, the VO4 and BiO8 units from chains that is parallel to the [10] direction. The important structural parameters after surface relaxation are listed in Table 6. The most stable (22) surface exposes fully 4-fold coordinated V atoms, as well as coordinately unsaturated atoms, a 1-fold coordinated O atom (O1BU), two 2-fold coordinated O atoms (O2BU and O2AU), and two 6-fold coordinated Bi atoms (Bi1 and Bi2). The VO4 tetrahedrons complicatedly stack in the (22) slab, in which the O atoms in the adjacent layer were stagger-arranged along the [22] direction. Except O2AL and O2BU, the most important inward relaxations are those atoms in the outermost two layers, especially the unsaturated O1BU (∼−0.17 Å). While those atoms in the third layer are displaced outward by ∼0.09 Å. Accordingly, the expansions of bond length and bond angle in the outermost two layers are much larger than that of the next two layers below. Before the surface relaxation, the metal atoms in adjacent layers (e.g. the first layer and the second layer, the third layer and the fourth layer) are located at the same height. But after the surface relaxation, lay spacing is not still zero, e.g. d12 = 0.004 Å, d34 = 0.073 Å as listed in Table 6. This implies that the outermost planes of metal atoms are slightly corrugated. From the layer spacing expansions, it is found that the surface relaxation is not important for the sixth layer. So the atoms in the sixth layer are located on the positions of the bulk-truncated surface.
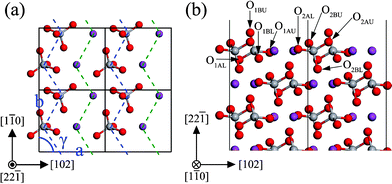 |
| | Fig. 12 The structure of the unrelaxed stoichiometric (22) surface: (a) top view (only the two outmost layers are shown), (b) side view. The atomic labels are the same as that in Table 6. | |
Table 6 Structure of the relaxed (22)surface. Atom labels refer to Fig. 12, also see the caption of Table 1. The corresponding lay spacing in the bulk is 0 Å and 3.057 Å. Expansion in parentheses are the absolute values
| Atomic displacement/Å |
Bond and bond angle expansion |
Lay spacing expansion |
| Label |
[22] |
Label |
[22] |
Label |
% |
Label |
% |
Label |
% |
|
O1AU |
−0.004 |
O3AU |
0.016 |
V1–O1AU |
3.37 |
V4–O4AU |
−0.42 |
d
12
|
(0.004) |
|
O1AL |
−0.073 |
O3AL |
0.043 |
V1–O1AL |
4.42 |
V4–O4AL |
0.38 |
d
23
|
−2.39 |
|
O1BU |
−0.169 |
O3BU |
0.096 |
V1–O1BU |
−7.77 |
V4–O4BU |
−0.89 |
d
34
|
(0.075) |
|
O1BL |
−0.043 |
O3BL |
0.059 |
V1–O1BL |
2.14 |
V4–O4BL |
0.83 |
d
45
|
−1.21 |
| V1 |
−0.038 |
V3 |
0.039 |
V2–O2AU |
−1.03 |
∠O1AU–V1–O1AL |
3.08 |
d
56
|
(0.008) |
|
Bi1 |
−0.047 |
Bi3 |
0.038 |
V2–O2AL |
2.48 |
∠O1BU–V1–O1BL |
−6.96 |
|
|
|
O2AU |
−0.118 |
O4AU |
−0.080 |
V2–O2BU |
−3.83 |
∠O2AU–V2–O2AL |
−0.62 |
|
|
|
O2AL |
0.054 |
O4AL |
−0.029 |
V2–O2BL |
2.49 |
∠O2BU–V2–O2BL |
−2.91 |
|
|
|
O2BU |
0.134 |
O4BU |
−0.058 |
V3–O3AU |
1.11 |
∠O3AU–V3–O3AL |
0.45 |
|
|
|
O2BL |
−0.073 |
O4BL |
0.029 |
V3–O3AL |
1.27 |
∠O3BU–V3–O3BL |
1.06 |
|
|
| V2 |
−0.032 |
V4 |
−0.040 |
V3–O3BU |
2.12 |
∠O4AU–V4–O4AL |
−0.47 |
|
|
|
Bi2 |
−0.154 |
Bi4 |
−0.028 |
V3–O3BL |
1.42 |
∠O4BU–V4–O4BL |
0.73 |
|
|
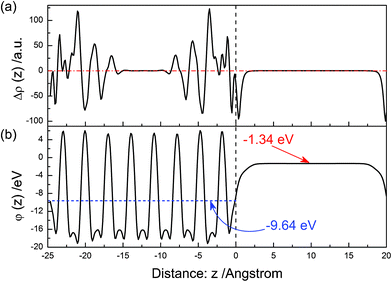
The electron density difference between before and after the (22)surface relaxation is shown in Fig. 13(a). Near above the surface, the electron density of vacuum decreases after the surface relaxation. At the range of 0–−5 Å, the value of Δρ(z) reaches the maximum at the position of ∼−4 Å. The electrons concentrate in the range of −1–−5 Å after the surface relaxation. As the in-depth distance increases, the value of Δρ(z) is oscillating, and this trend gradually disappears. The electrostatic potential of the relaxed (22) surface is shown in Fig. 13(b). The average potential of the BiVO4 layer is −9.64 eV, and that in the middle of the vacuum layer is −1.34 eV.
 |
| | Fig. 13 The same as Fig. 3 but for the (22) surface. | |
3.3 Overview of the surface properties of monoclinic clinobisvanite BiVO4
The most stable terminated plane for every surface is described in detail in Section 3.2. As pointed out in the above discussions, it is found that the most stable terminated planes belong to the type “1” surfaces (neutral planes with equal numbers of anions and cations parallel to the surface) according to Tasker's category that is based on electrostatic considerations.28 In these most stable planes, the V atoms are fully coordinated, and all the dangling bonds are derived from the broken Bi–O bonds. Thus, on these low-index surfaces, the VO4 tetrahedron keeps intact because of the strong covalent V–O bonds, while the nearby BiO8 dodecahedron is cut instead. In this way, they obey the rules of autocompensation (the excess charge from cation-derived dangling bonds compensates anion-derived dangling bonds).29
The calculated surface energies of these six low-index surfaces, both before and after the surface relaxation, are summarized in Table 7. Among the six low-index orientations, (010) surface has the lowest surface energy. Surface energy can be attributed to the energy required to break bonds when a surface is created. Therefore a low-energy surface generally has fewer Bi–O bonds affected by the surface cut. For example, the low-energy (010) surface has a Bi coordination number loss of about 7.67 bonds per nm2, compared with a value of about 10.19 bond per nm2 for the high-energy (100) surface. In other words, the most important factors in determining the stability of monoclinic BiVO4 surfaces is the dangling bonds density of Bi atoms. This is clearly displayed in Table 7, the surface energy approximately increase with the increase of the dangling bonds density of unsaturated Bi atoms.
Table 7 Structure and formation energies of various surfaces, calculated in the present work. In the left panel, the two-dimension lattice parameters of surface primitive cell are shown in Fig. 2–Fig. 12. In the central panels, the surface energies of the unrelaxed surfaces (γunrel) and relaxed surfaces (γrel) are reported. In the right panel, the surface densities of dangling bonds (n) of Bi and the relative fraction areas for the surfaces exposed on the computed crystal shape are given
| |
2D Lattice parameter |
Surface energy (γ)/J m−2 |
n/nm−2 |
Fraction |
|
γ
unrel
|
γ
rel
|
Δγ |
| (010) |
a = b = 5.107 Å |
0.6824 |
0.5016 |
0.1808 |
7.67 |
25.0% |
|
γ = 89.992° |
| (100) |
a = 11.526 Å, b = 5.107 Å |
1.9550 |
0.8848 |
1.0702 |
10.19 |
|
|
γ = 90° |
| (001) |
a = b = 6.801 Å |
1.2836 |
0.8765 |
0.4071 |
9.61 |
|
|
γ = 115.862° |
| (110) |
a = 5.107 Å, b = 6.801 Å |
1.0948 |
0.5517 |
0.5431 |
9.32 |
37.5% |
|
γ = 112.049° |
| (11) |
a = 5.107 Å, b = 6.801 Å |
1.0954 |
0.5496 |
0.5458 |
9.32 |
37.5% |
|
γ = 67.951° |
| (22) |
a = 7.222 Å, b = 6.801 Å |
1.0496 |
0.6044 |
0.4452 |
8.14 |
|
|
γ = 89.999° |
As expected, larger dangling bond density leads to more pronounced surface relaxation. For example, with the largest dangling bond density (10.19 nm−2), the (100) surface has the largest difference of surface energy (Δγ = ∼1.07 J m−2). However, the surface relaxation is related to the type of unsaturated Bi atom at the same time. The more broken bonds of Bi atom there are on the surface, the more remarkable the surface relaxation for this surface. The (22) surface contains 6-fold coordinated Bi atoms, while the (001) surface contains 5-fold and 7-fold coordinated Bi atoms. Thereby, the surface energy difference of the (001) surface is smaller than that of the (22) surface.
The common characteristics of surface relaxation are summarized as follows. The surface relaxation significantly occurs in the outermost two layers, especially in the first layer. In the case of (010)/(001)/(22) surface, most atoms in the first layer are displaced inward, so the corresponding lay spacing is compressed. While the situations are completely opposite in the case of (100)/(110)/(11): most atoms in the first layer are displaced outward, and the corresponding lay spacing is elongated. Because of the unbalanced interaction between surface atoms, the new cleaved surfaces will be relaxed, and the surface relaxation will result in electron redistribution. By doing so, the interaction between surface atoms can be balanced, and the surface achieves the stable states. The figures of electron density difference clearly show this surface effect, the electrons will concentrate in a small range below the surface after the surface relaxation. Except the (110) and (11) surfaces, the electron density of vacuum near the surface is decreased. So the electrostatic potential of vacuum of the (110) and (11) surfaces are smaller by about 1 eV than that of other surfaces. However, for these surfaces, the average electrostatic potentials of surface layer are nearly equivalent, ∼−9.5 eV. Another important feature for monoclinic BiVO4 surfaces is that the surface properties of the (110) surfaces are almost the same as that of the (11) surfaces. The reason is that the crystal structure of monoclinic BiVO4 is similar with that of tetragonal BiVO4, so the former can be seen as slightly distorted from the latter.
The calculated surface energies can be used to determine the thermodynamically stable macroscopic crystal shape via the Wulff construction.30 Generally, the lower in energy a surface is, the more area the facet contributes to the crystal shape. Fig. 14 shows the crystal shape of monoclinic BiVO4, according to the surface energies of Table 7. For the monoclinic BiVO4 crystal, only three facets, {010}, {110} and {11}, are exposed to the vacuum, and form a truncated regular octahedron. This calculated result is in agreement with experimental observations for naturally occurring monoclinic clinobisvanite mineral31 and SEM images of its nanoparticles15. The most stable {010} facets form about 25% of the total crystal shape area. The remaining 75% are contributed by the similar {110} and {11}facets. In monoclinic structure the average surface energy for a macroscopic crystal is 0.54 J m−2 for the relaxed surfaces.
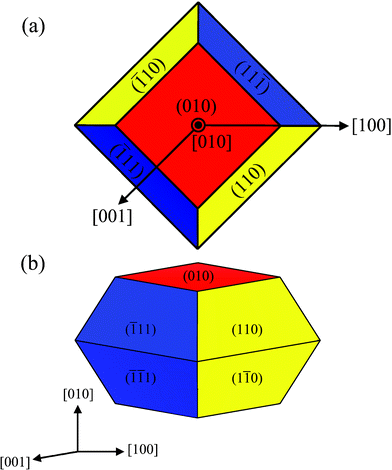 |
| | Fig. 14 The equilibrium shape of a BiVO4 crystal in the monoclinic clinobisvanite phase, according to the Wulff construction and the calculated surface energy of Table 7. (a) Top view, and (b) perspective view. | |
4. Conclusions
In conclusion, the present work has presented comprehensive density functional theory calculations for several low-index stoichiometric monoclinic BiVO4 surfaces. Firstly, the surface properties for every surface were described in details. Then, the similarities and differences between these surfaces were compared and analyzed. Finally, on the basis of the calculated surface energies, the equilibrium crystal shape of monoclinic BiVO4 was determined, and its average surface energy was estimated. In all of the most stable terminated planes, the V atoms are fully coordinated, and all the dangling bonds are derived from the broken Bi-O bonds. So for these low-index surfaces, the VO4 tetrahedron keeps intact, while the BiO8 dodecahedron is cut instead. The (010) surface is thermodynamically lowest-energy surface of monoclinic clinobisvanite BiVO4. But its predominant surfaces are the (110) and (11) surfaces, which have almost exactly the same surface properties. As a final remark, it was pointed out that the dangling bonds density of bismuth atom determines not only the surface energy, but also the surface relaxation. With the present work, we hope to provide calculated results that will be useful for future studies on the surface reaction and the physical chemical properties of monoclinic BiVO4 surface, especially for the photocatalysis applications.
Acknowledgements
The authors acknowledge the financial support from the National Basic Research Program of China (973 Program, Grant Nos. 2007CB613301 and 2007CB613305), China-Japan cooperation project of science and technology (2009DFA61090), the National Natural Science Foundation of China (50732004 and 21073090), and the Jiangsu Provincial Science and Technology Research Program (BK2008028 and BE2009140).
References
- A. Kudo, K. Ueda, H. Kato and I. Mikami, Catal. Lett., 1998, 53, 229 CrossRef CAS.
- A. Kudo, K. Omori and H. Kato, J. Am. Chem. Soc., 1999, 121, 11459 CrossRef CAS.
- S. Kohtani, M. Koshiko, A. Kudo, K. Tokumura, Y. Ishigaki, A. Toriba, K. Hayakawa and R. Nakagaki, Appl. Catal., B, 2003, 46, 573 CrossRef CAS.
- S. Kohtani, J. Hiro, N. Yamamoto, A. Kudo, K. Tokumura and R. Nakagaki, Catal. Commun., 2005, 6, 185 CrossRef CAS.
- K. Sayama, A. Nomura, Z. Zou, R. Abe, Y. Abe and H. Arakawa, Chem. Commun., 2003, 2908 RSC.
- X. Zhang, Z. Ai, F. Jia, L. Zhang, X. Fan and Z. Zou, Mater. Chem. Phys., 2007, 103, 162 CrossRef CAS.
- S. Tokunaga, H. Kato and A. Kudo, Chem. Mater., 2001, 13, 4624 CrossRef CAS.
- J. Yu and A. Kudo, Adv. Funct. Mater., 2006, 16, 2163 CrossRef CAS.
- K. Sayama, A. Nomura, T. Arai, T. Sugita, R. Abe, M. Yanagida, T. Oi, Y. Iwasaki, Y. Abe and H. Sugihara, J. Phys. Chem. B, 2006, 110, 11352 CrossRef CAS.
- M. Long, W. Cai and H. Kisch, J. Phys. Chem. C, 2008, 112, 548 CAS.
- Z. Zhao, Z. Li and Z. Zou, Phys. Chem. Chem. Phys., 2011, 13, 4746 RSC.
- Z. Zhao, W. Luo, Z. Li and Z. Zou, Phys. Lett. A, 2010, 374, 4919 CrossRef CAS.
- L. Zhang, D. Chen and X. Jiao, J. Phys. Chem. B, 2006, 110, 2668 CrossRef CAS.
- G. Xi and J. Ye, Chem. Commun., 2010, 46, 1893 RSC.
- D. Wang, H. Jiang, X. Zong, Q. Xu, Y. Ma, G. Li and C. Li, Chem.–Eur. J., 2011, 17, 1275 CrossRef CAS.
- A. Walsh, Y. Yan, M. N. Huda, M. M. Al-Jassim and S. H. Wei, Chem. Mater., 2009, 21, 547 CrossRef CAS.
- M. Oshikiri, M. Boero, A. Matsushita and J. Ye, J. Chem. Phys., 2009, 131, 034701 CrossRef.
- M. Oshikiri, M. Boero, J. Ye, Z. Zou and G. Kido, J. Chem. Phys., 2002, 117, 7313 CrossRef CAS.
- M. W. Stoltzfus, P. M. Woodward, R. Seshadri, J.-H. Klepeis and B. Bursten, Inorg. Chem., 2007, 46, 3839 CrossRef CAS.
- M. R. Dolgos, A. M. Paraskos, M. W. Stoltzfus, S. C. Yarnell and P. M. Woodward, J. Solid State Chem., 2009, 182, 1964 CrossRef CAS.
- M. Oshikiri and M. Boero, J. Phys. Chem. B, 2006, 110, 9188 CrossRef CAS.
- M. Oshikiri, M. Boero, A. Matsushita and J. Ye, J. Electroceram., 2009, 22, 114 CrossRef CAS.
- S. J. Clark, M. D. Segall, C. J. Pickard, P. J. Hasnip, M. J. Probert, K. Refson and M. C. Payne, Z. Kristallogr., 2005, 220, 567 CrossRef CAS.
- J. P. Perdew, K. Burke and M. Ernzerhof, Phys. Rev. Lett., 1996, 77, 3865 CrossRef CAS.
- B. G. Pfrommer, M. Câté, S. G. Louie and M. L. Cohen, J. Comput. Phys., 1997, 131, 233 CrossRef CAS.
- J.-C. Liu, J.-P. Chen and D.-C. Li, Acta Phys. Sin., 1983, 32, 1053 CAS.
- A. W. Sleight, H. Y. Chen, A. Ferretti and D. E. Cox, Mater. Res. Bull., 1979, 14, 1571 CrossRef CAS.
- P. W. Tasker, J. Phys. C: Solid State Phys., 1979, 12, 4977 CrossRef CAS.
- J. P. LaFemina, Crit. Rev. Surf. Chem., 1994, 3, 297 CAS.
- G. Wulff, Z. Kristallogr. Mineral., 1901, 34, 449 CAS.
-
S Wolfsried, 2007,
http://www.mindat.org/photo-85659.html
.
|
| This journal is © The Royal Society of Chemistry 2011 |